The Intel SSD 600p (512GB) Review
by Billy Tallis on November 22, 2016 10:30 AM ESTPerformance Consistency
Our performance consistency test explores the extent to which a drive can reliably sustain performance during a long-duration random write test. Specifications for consumer drives typically list peak performance numbers only attainable in ideal conditions. The performance in a worst-case scenario can be drastically different as over the course of a long test drives can run out of spare area, have to start performing garbage collection, and sometimes even reach power or thermal limits.
In addition to an overall decline in performance, a long test can show patterns in how performance varies on shorter timescales. Some drives will exhibit very little variance in performance from second to second, while others will show massive drops in performance during each garbage collection cycle but otherwise maintain good performance, and others show constantly wide variance. If a drive periodically slows to hard drive levels of performance, it may feel slow to use even if its overall average performance is very high.
To maximally stress the drive's controller and force it to perform garbage collection and wear leveling, this test conducts 4kB random writes with a queue depth of 32. The drive is filled before the start of the test, and the test duration is one hour. Any spare area will be exhausted early in the test and by the end of the hour even the largest drives with the most overprovisioning will have reached a steady state. We use the last 400 seconds of the test to score the drive both on steady-state average writes per second and on its performance divided by the standard deviation.
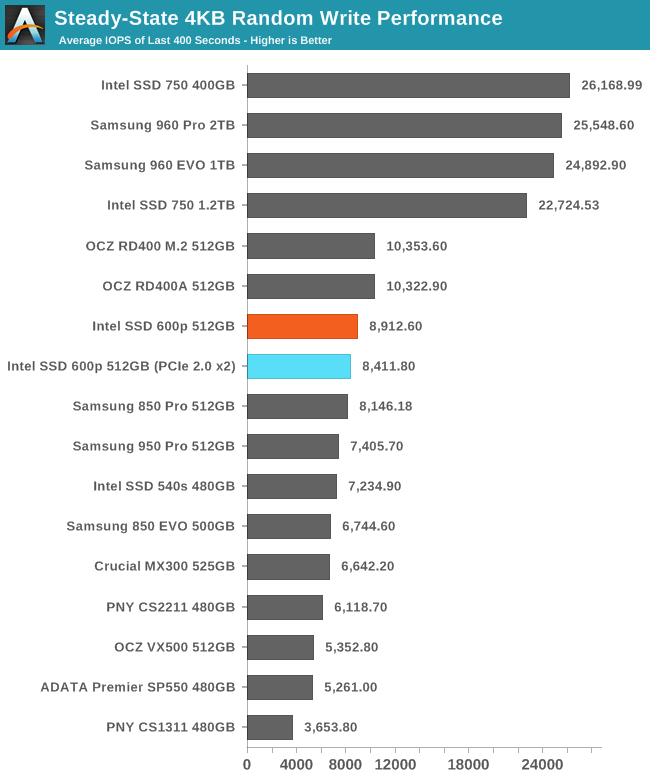
The Intel 600p's steady state random write performance is reasonably fast, especially for a TLC SSD. The 600p is faster than all of the SATA SSDs in this collection. The Intel 750 and Samsung 960s are in an entirely different league, but the OCZ RD400 is only slightly ahead of the 600p.
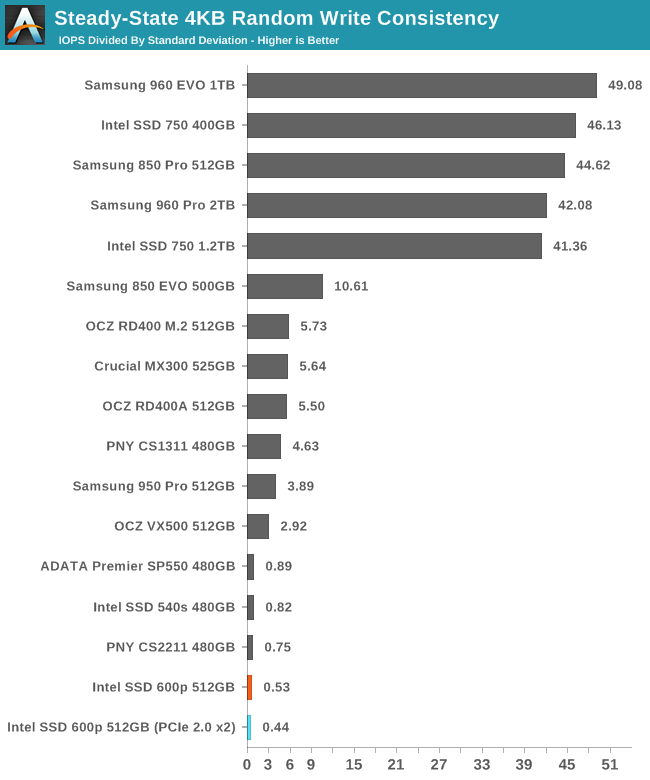
Despite a decently high average performance, the 600p has a very low consistency score, indicating that even after reaching steady state, the performance varies widely and the average does not tell the whole story.
 |
|||||||||
| Default | |||||||||
| 25% Over-Provisioning | |||||||||
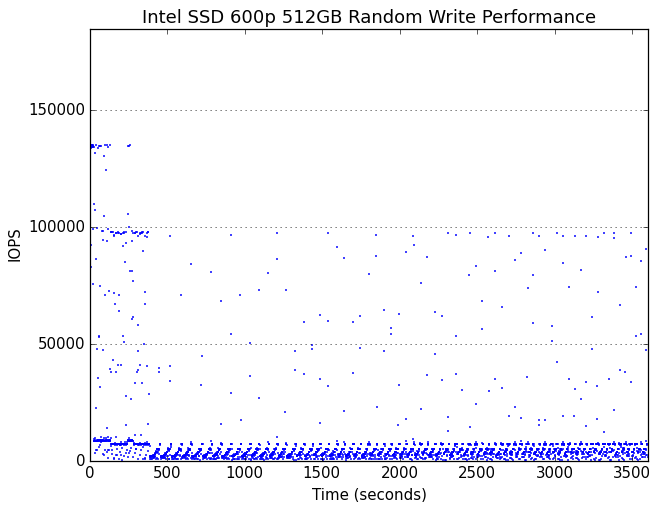
Very early in the test, the 600p begins showing cyclic drops in performance due to garbage collection. Several minutes into the hour-long test, the drive runs out of spare area and reaches steady state.
 |
|||||||||
| Default | |||||||||
| 25% Over-Provisioning | |||||||||
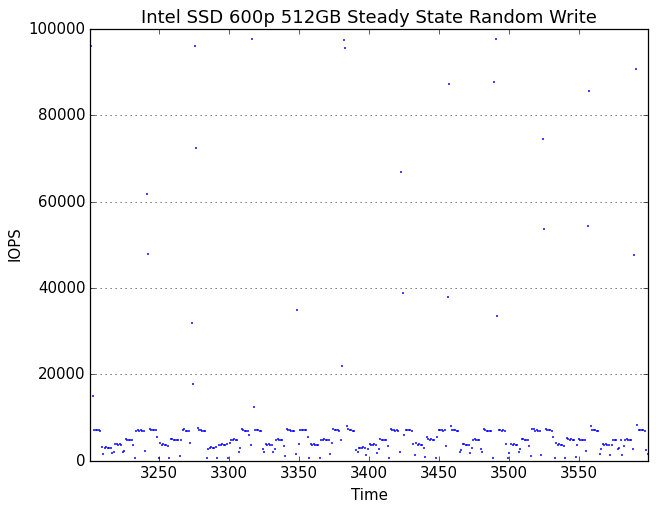
In its steady state, the 600p spends most of the time tracing out a sawtooth curve of performance that has a reasonable average but is constantly dropping down to very low performance levels. Oddly, there are also brief moments of unhindered performance where the drive spikes to exceptionally high performance of up to 100k IOPS, but these are short and infrequent enough to have little impact on the average performance. It would appear that the 600p occasionally frees up some SLC cache, which then immediately gets used up and kicks off another round of garbage collection.
With extra overprovisioning, the 600p's garbage collection cycles don't drag performance down as far, making the periodicity less obvious.


63 Comments
View All Comments
ramvalleru - Tuesday, December 6, 2016 - link
What advantages does Intel 600p has over Samsung 850 Evo with its 4 x pci-e. Less bottleneck with multi application writes and reads?KAlmquist - Friday, December 9, 2016 - link
If you mean compared to the 960 EVO, the 600p is less expensive. Also, with the 600p you are getting the Intel brand name and quality control, backed up with a 5 year warranty vs. a 3 year warranty on the 960 EVO.RetsamCP - Saturday, December 24, 2016 - link
I may just be a little confused but how did the 960 Pro 2TB bench and average service time latency of 160.9 ms in the Destroyer bench but score 0 for percentage of service times >100 ms?There had to be service times over 100 ms for the average to be over 100 ms, but how was the average affected so much when service times >100 ms made up <0.01% of the total benchmark?
What am I missing?