The AMD Ryzen 3 3300X and 3100 CPU Review: A Budget Gaming Bonanza
by Dr. Ian Cutress on May 7, 2020 9:00 AM ESTPower Consumption and Frequency Ramps
On the box, both processors are listed as having 65 W TDPs. With its Zen-based hardware, AMD has been relatively good at staying around that official on-the-box value, even during turbo. In the last generation, AMD introduced a feature called PPT, or Package Power Tracking.
- For 105 W processors, PPT is >142 W
- For 65 W processors, PPT is >88 W
- For 45 W processors, PPT is >60W
This allows the processor to raise its power limits, assuming it isn’t breaching thermal limits or current limits, and consequently raise the frequency. As a result, while we see 65 W on the box, the real world power consumption during most tasks is likely to be nearer 88 W, unless the current or thermal lines are crossed.
As a new element to our testing, we are recording power over a number of benchmarks in our suite, rather than just a simple peak power test.
AMD Ryzen 3 3300X
For the faster chip, we saw a peak power in both of our tests of around 80 W.
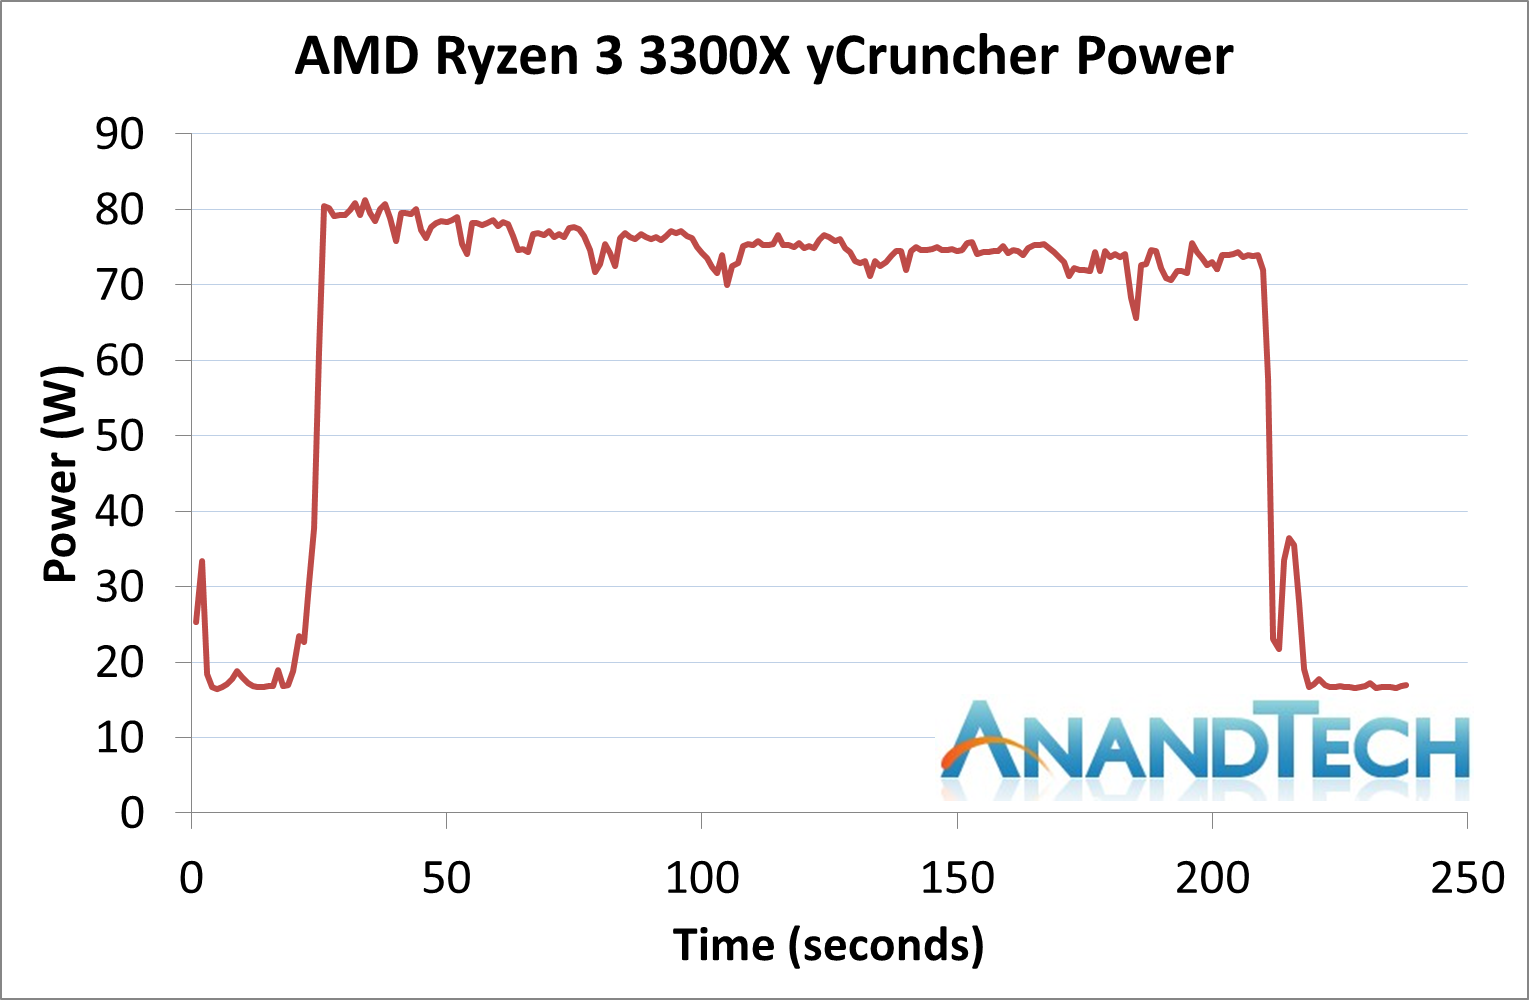
With yCruncher, which is somewhat of a periodic load, the power consumption dropped over time to nearer 75 W.
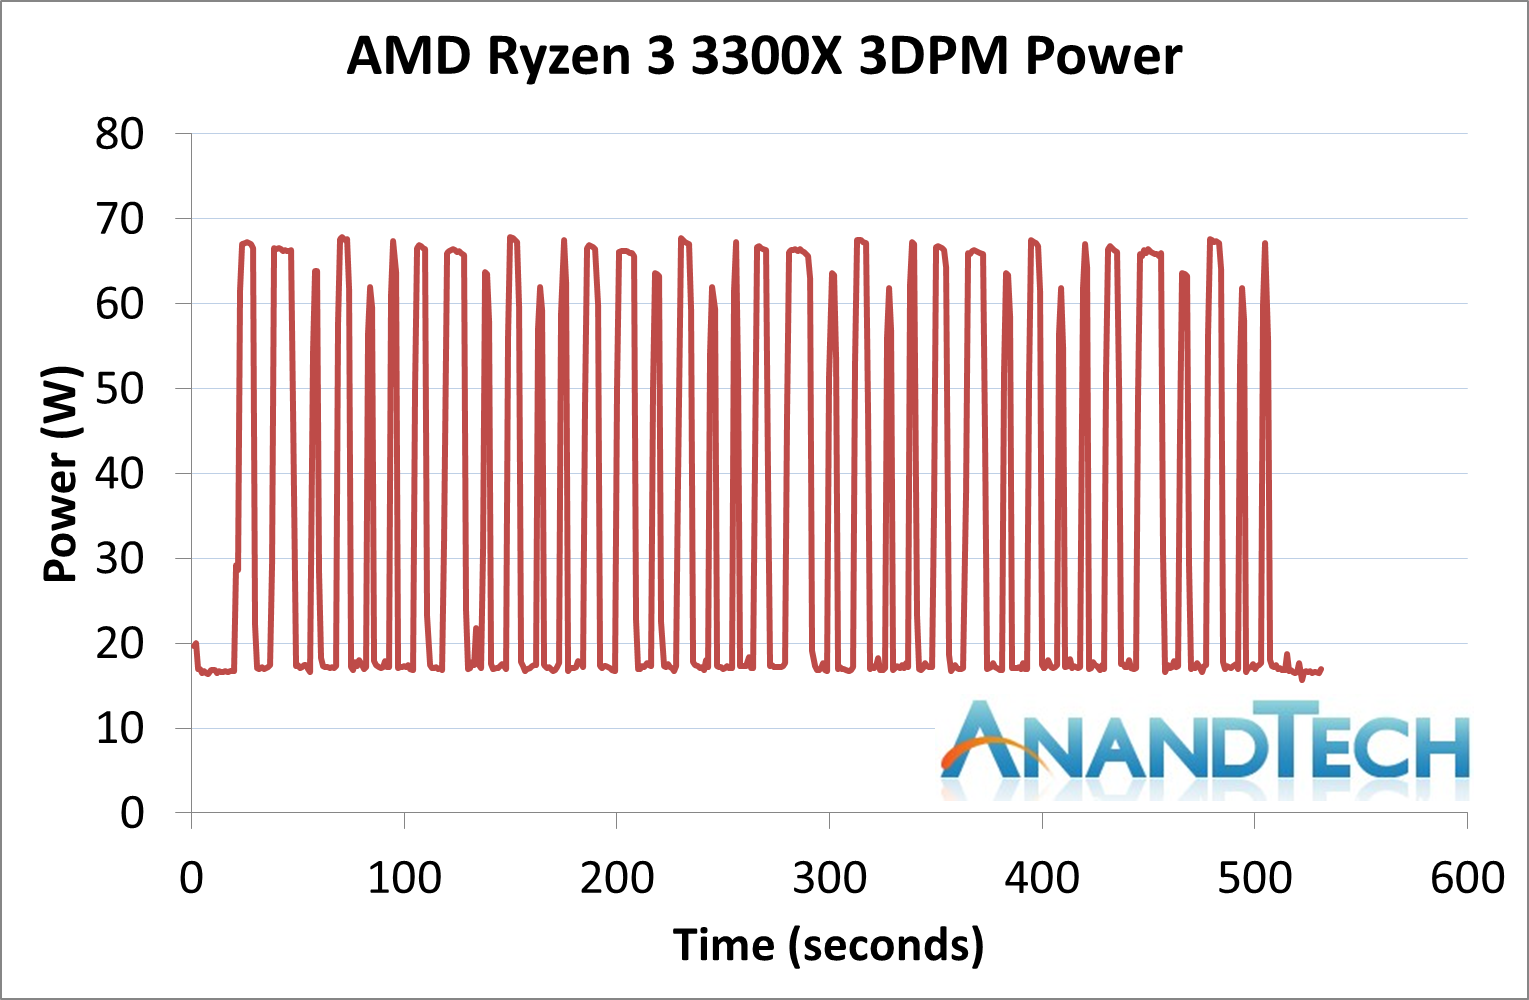
3DPM is more obvious with its idle steps between loads, being 10 seconds on then 10 seconds waiting. The power almost peaked at a similar amount here.
In both of these graphs, the package power when idle is around 16-17 W. I looked back through the data, and noticed that out of this power only 0.3 W was actually dedicated to cores, with the rest being towards the big IO die, the memory controllers, and the Infinity Fabric. That’s still pretty substantial for an idle load.
At low loads, the power per core was around 14 W, while at full load it was slightly less depending on the test. This is a bit away from the 20 W per core we get from the high end Zen 2 processors, but these only go to 4.3 GHz, not 4.7 GHz+. This is about in line with what we expect.
On our frequency ramp test, the Ryzen 3300X went from an idle state to peak power within 17 milliseconds, or approximately a frame at 60 Hz.
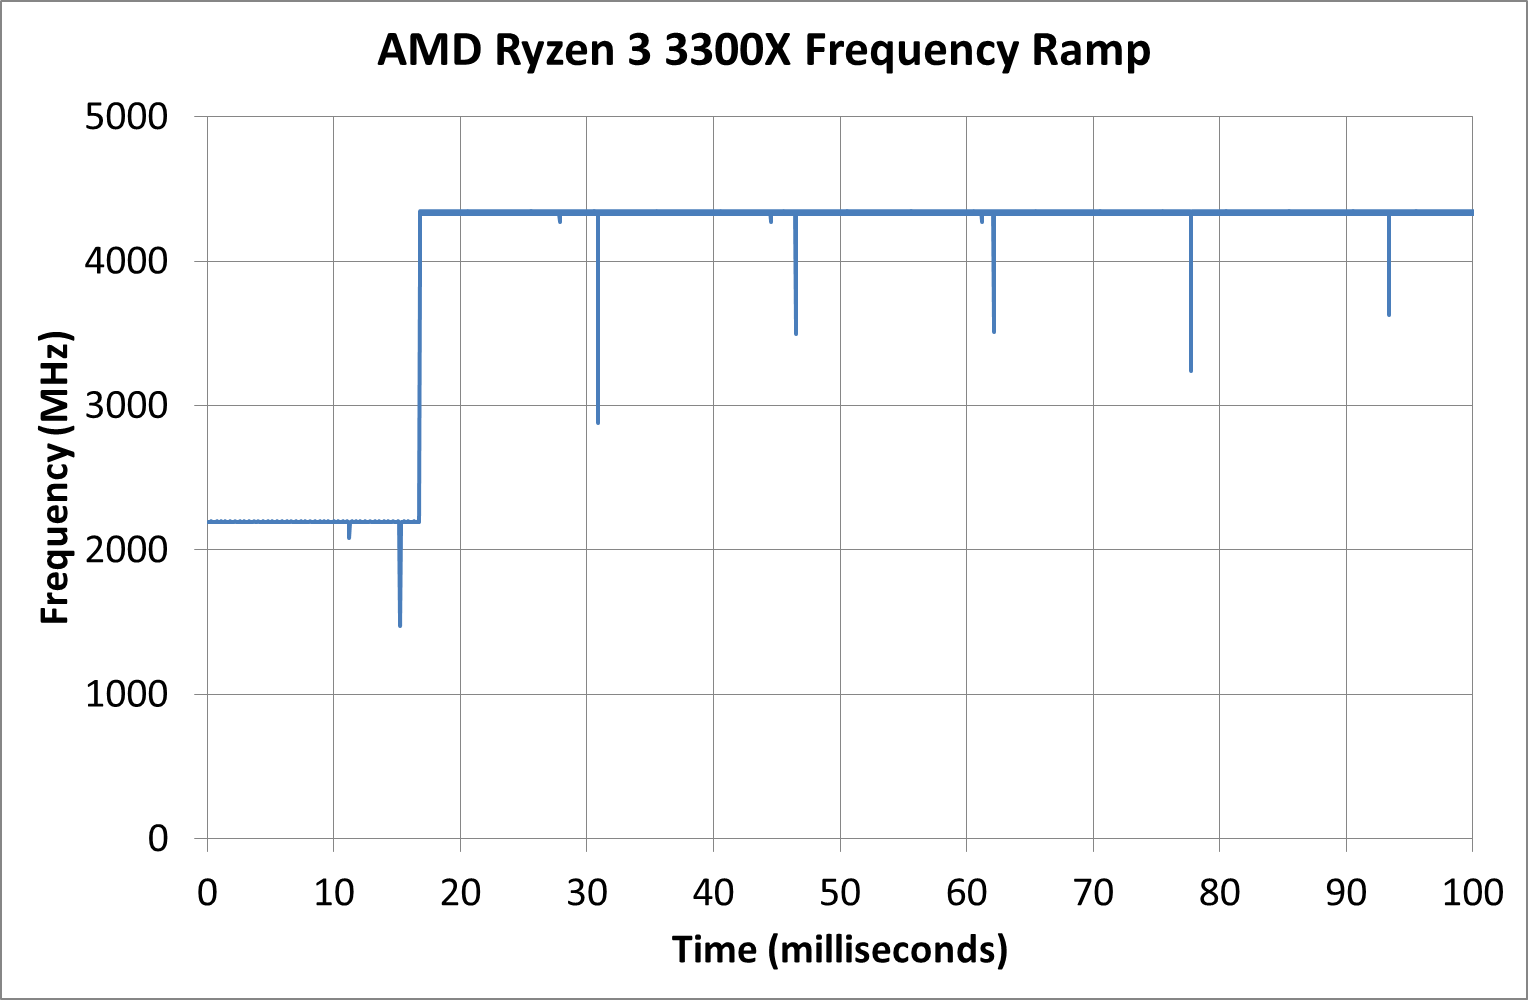
One of the new features with Ryzen 3000 is CPPC2 support, which AMD claims to reduce idle-to-turbo ramping from 30 milliseconds to 2 milliseconds. We’re seeing something in the middle of that, despite having all the updates applied. That being said, the jump up to the peak frequency (we measured 4350 MHz, +50 MHz over the turbo on the box) is effectively immediate with zero skew across a range of frequencies.
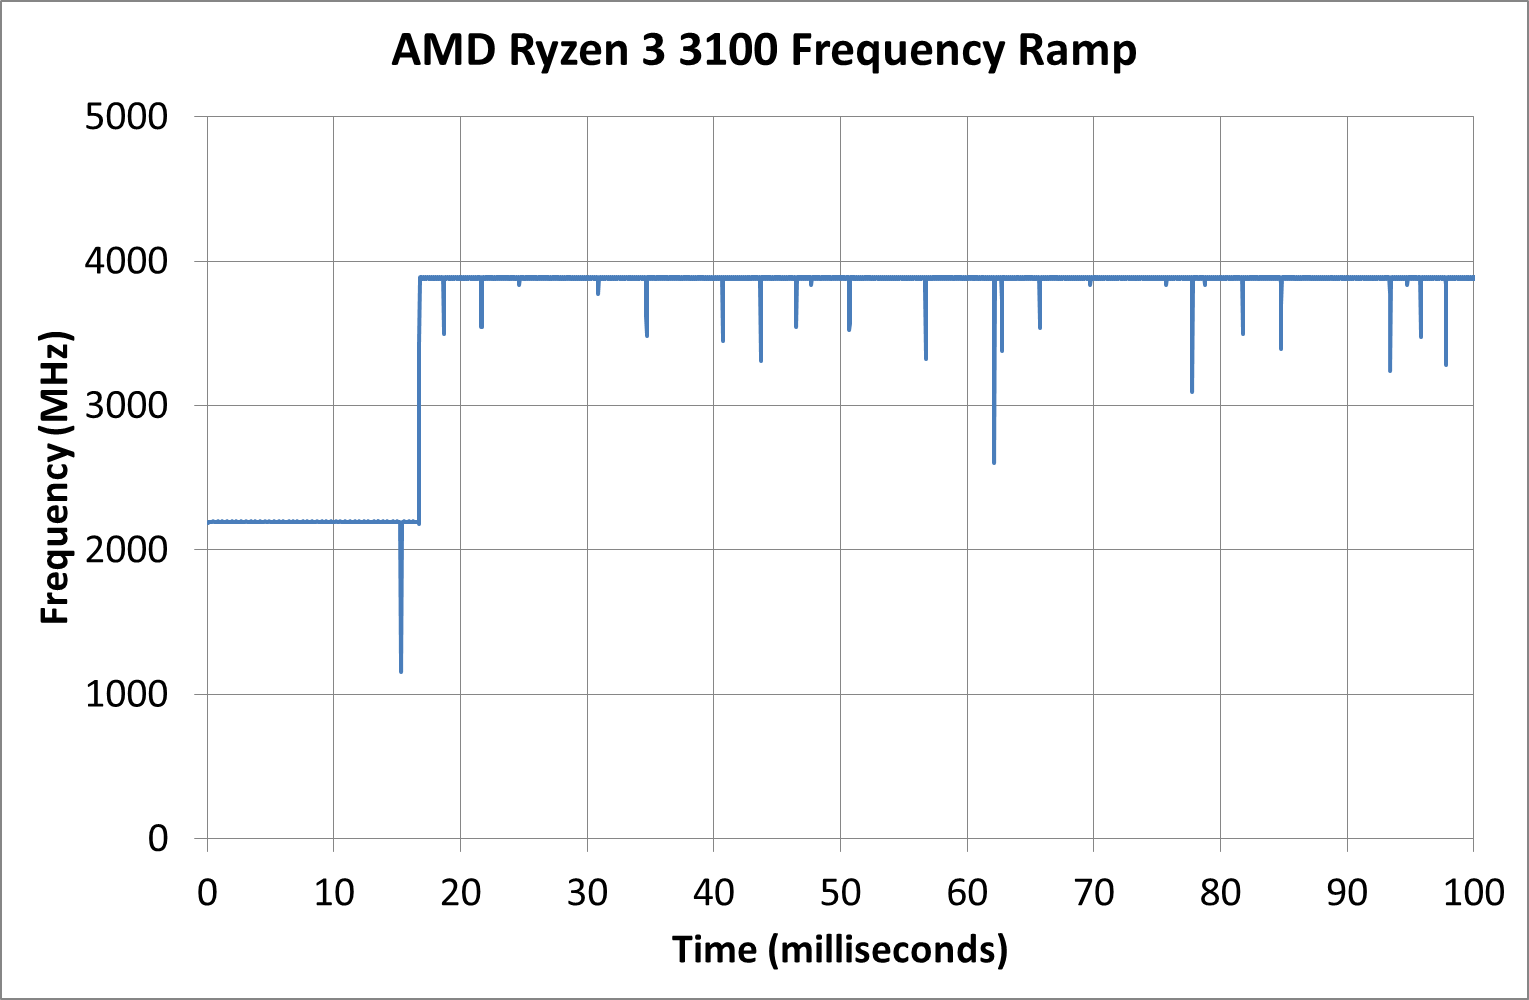
AMD Ryzen 3 3100
Given that the TDP number on the side of the box says 65 W as well, any reasonable user would assume that the power of this chip would be equal, right? Regular readers will know that this isn’t always the case.

In our yCruncher test, because the turbo frequency is lower than the 3300X, it means the voltage can be lower, and thus power is lower. Our history of testing Zen 2 has shown that these cores get very efficient at lower frequencies, to the point where our processor doesn’t even break that 65 W threshold during yCruncher.
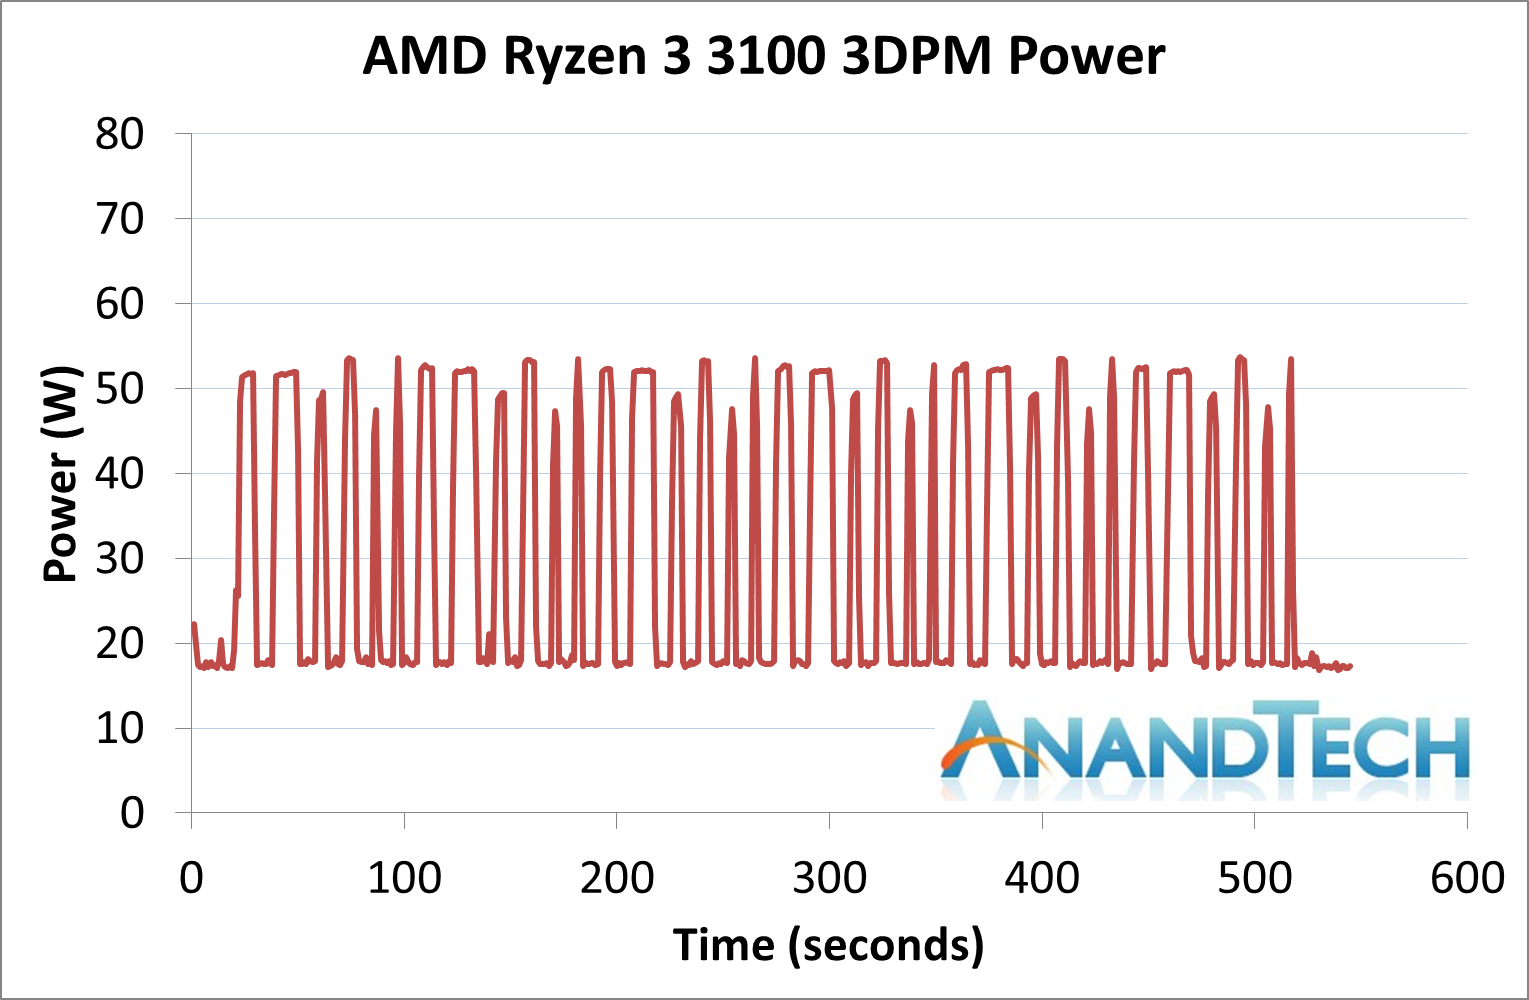
Similarly the 3DPM peaks are also lower, barely going to 55 W during an AVX2 workload.
On the frequency ramp side, we see another instance of a 16-17 ms transition.
Summary
For the peak power out of all of our testing, we saw the Ryzen 3 3300X hit a maximum of 80 W, and the Ryzen 3 3100 go to 62 W. When we compare that to the Core i7-7700K, at 91 W TDP / 95 W peak, combined with most of the results on the next few pages, AMD by comparison is more efficient.


249 Comments
View All Comments
paulemannsen - Saturday, May 9, 2020 - link
@schujj07 Interesting. Your claim sounds totally alien to me, so can you show us some examples where a CPU is significantly slower in 1080p than in 720p when the GPU isnt the bottleneck pls?schujj07 - Sunday, May 10, 2020 - link
Just look at this review and there are a couple examples of this a 720p and 1080p ultra.Spunjji - Monday, May 11, 2020 - link
@superdawgwtfd - If the resolution is too low then you artificially amplify the differences between CPUs. Meanwhile at 1080p you're testing a resolution people will acttually use for high-frame-rate displays, and a decent GPU is still not going to be the primary limit at that resolution.Fataliity - Friday, May 8, 2020 - link
Also a 7700K should be similar to the new 10th gens with same amount of cores. It's same arch / node. Just frequency changes (and I think the low end new ones are saame or slightly lower.Ian Cutress - Friday, May 8, 2020 - link
7700K was tested last year on the same driver sets. It's been in Bench for a whileschujj07 - Thursday, May 7, 2020 - link
The 9100F is 4c/4t with a 3.6/4.2 clock. The 7700k is 4c/8t with a 4.2/4.5 clock. Since both the 7th & 9th gen are both Sky Lake, they will have identical IPC. Based on that we know that the 9100F will perform worse than the 7700k and makes that inclusion pretty pointless. Not to mention that Ian said he never got review samples of the 9th gen i3's. In a lot of the benchmarks we see the R5 1600 & 2600 and the 1600AF will be right between those 2 CPUs in performance. The inclusion of the 4790k and 8086k are nice as they show comparisons from the top 2014 CPU and 2018 CPU. When it comes to single threaded applications, a stock 8086k will be as fast than as a stock 9900k due to having the same boost and IPC. Therefore we are able to extrapolate a lot of data from this whole thing.Spunjji - Monday, May 11, 2020 - link
You made a succession of excellent points here. Alas, I feel some people would rather use their brain for trolling than for processing the information they claim to want in the course of said trolling.crimson117 - Thursday, May 7, 2020 - link
1600AF performance is identical to the 2600, so just use that.3600 is an unfortunate omission.
schujj07 - Thursday, May 7, 2020 - link
Due to the clock differences between the 2 CPUs that is false. The 1600AF will fall between the 1600 & 2600 in performance.crimson117 - Thursday, May 7, 2020 - link
You're right, not identical, but like 95% the performance at worst and often exactly the same in practice (especially gaming above 1080p): https://www.techspot.com/review/1977-amd-ryzen-160...