The Samsung 870 QVO (1TB & 4TB) SSD Review: QLC Refreshed
by Billy Tallis on June 30, 2020 11:40 AM ESTBurst IO Performance
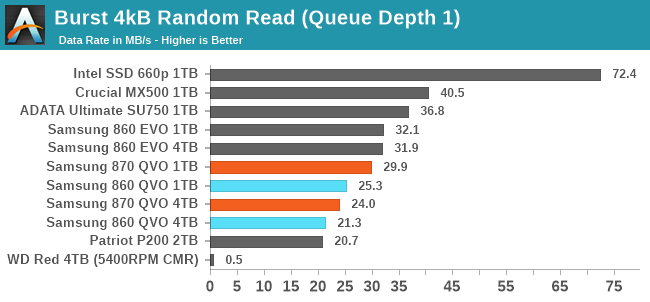
Our burst IO tests run at a queue depth of one and the amount of data transferred is limited to ensure that SLC write buffers don't fill up and controllers don't overheat. In between each burst there's enough idle time to keep the drive averaging a 20% duty cycle, allowing for some buffered writes and deferred garbage collection to be completed. The random read and write tests use 4kB operations and the sequential tests use 128kB operations. All the burst tests are confined to a 16GB portion of the drive, so DRAMless SSDs are not disadvantaged as much as they are for larger tests.
 |
|||||||||
| Random Read | Random Write | ||||||||
| Sequential Read | Sequential Write | ||||||||
The Samsung 870 QVOs show significant improvement to QD1 random read performance, with the 1TB model still outperforming the 4TB model. QLC still imposes a bit of a performance penalty relative to mainstream SATA drives, but the biggest difference on display here is naturally from the NVMe drive serving the reads entirely out of its huge SLC cache.
For random writes at QD1, the 870 QVO is a stark regression from its predecessor, which was on par with the TLC-based 860 EVO. The 870 QVO is now clearly slower than mainstream TLC SSDs and is barely faster than the slower DRAMless competitor.
Sequential reads and writes at QD1 both show slight improvements, but these drives are almost all simply bumping against the limits of the SATA interface.
Sustained IO Performance
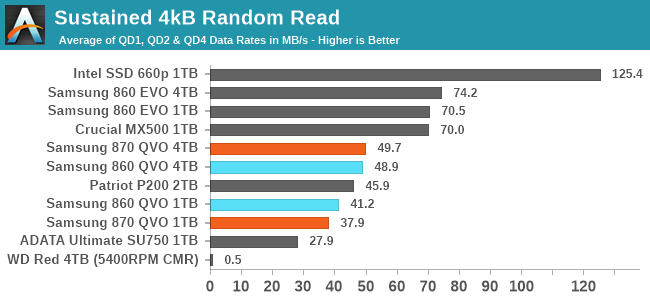
Our sustained IO tests measure performance on queue depths up to 32, but the scores reported here are only the averages for the low queue depths (1,2,4) that are most representative of real-world consumer workloads. Each queue depth is tested for up to one minute or 32GB, and the tests are confined to a 64GB span of the drive.
 |
|||||||||
| Random Read | Random Write | ||||||||
| Sequential Read | Sequential Write | ||||||||
 |
|||||||||
| Random Read | Random Write | ||||||||
| Sequential Read | Sequential Write | ||||||||
The most notable performance changes the 870 QVO brings to the sustained IO tests are from the 1TB model, which has greatly improved both random and sequential write performance. However, this comes at the cost of reduced random read performance, which is also a weakness for the 4TB model.
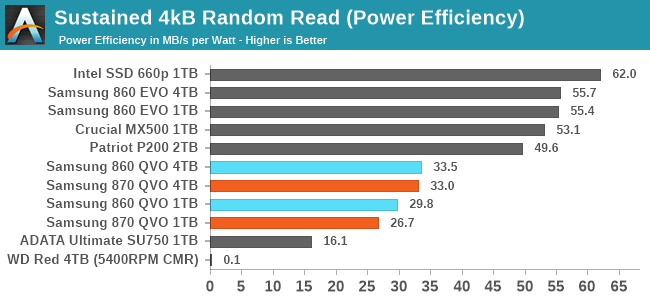
Power efficiency from the 870 QVOs during the sustained IO tests ranges from poor to average. Samsung's controller and LPDDR4 help keep power draw in check, but ultimately it takes more energy to operate slower, more complicated QLC NAND.
 |
|||||||||
| Random Read | Random Write | ||||||||
| Sequential Read | Sequential Write | ||||||||
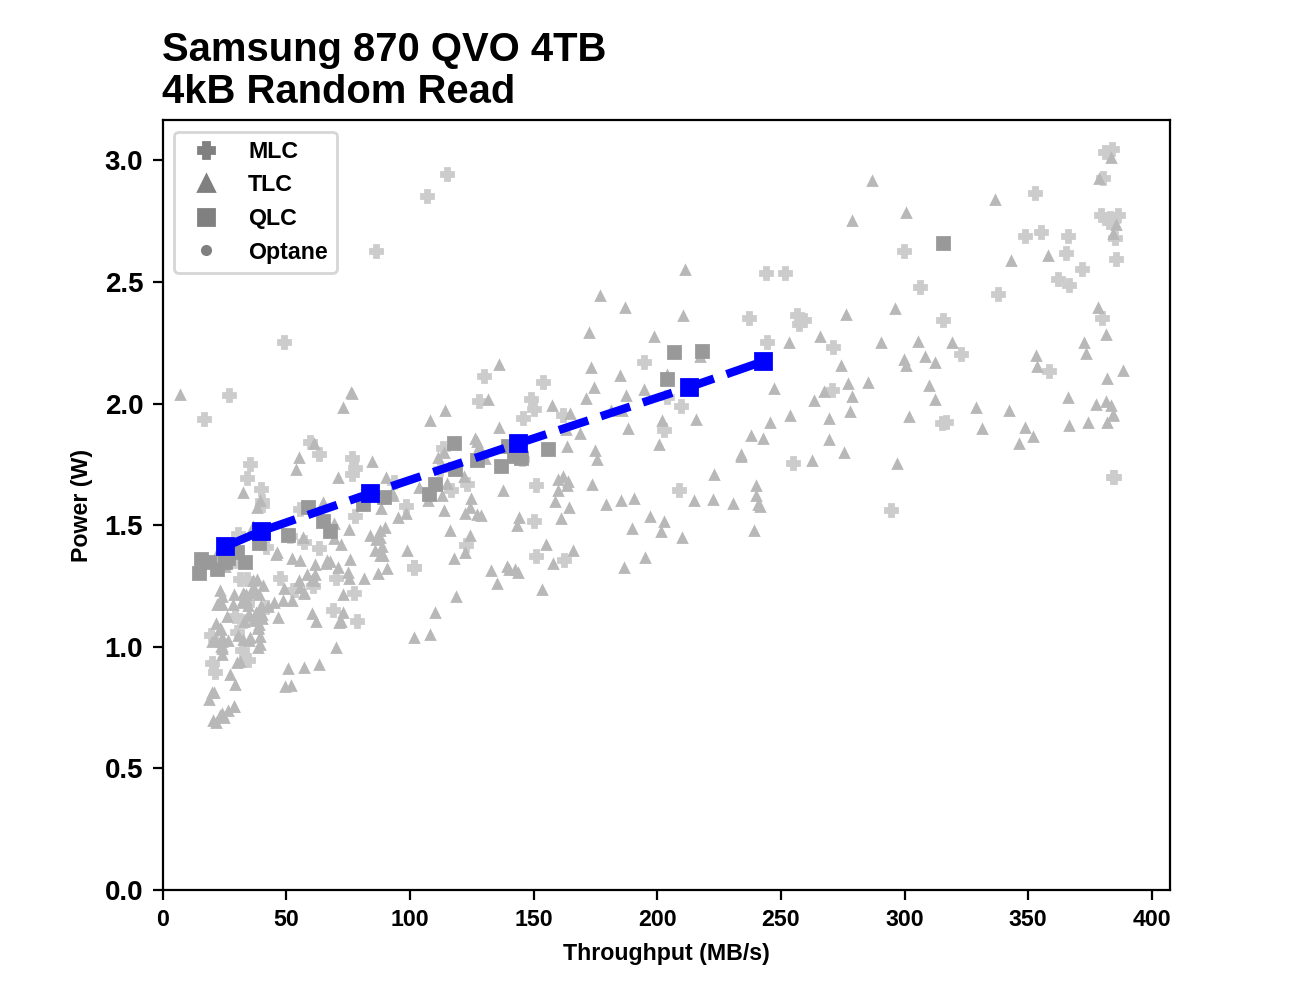
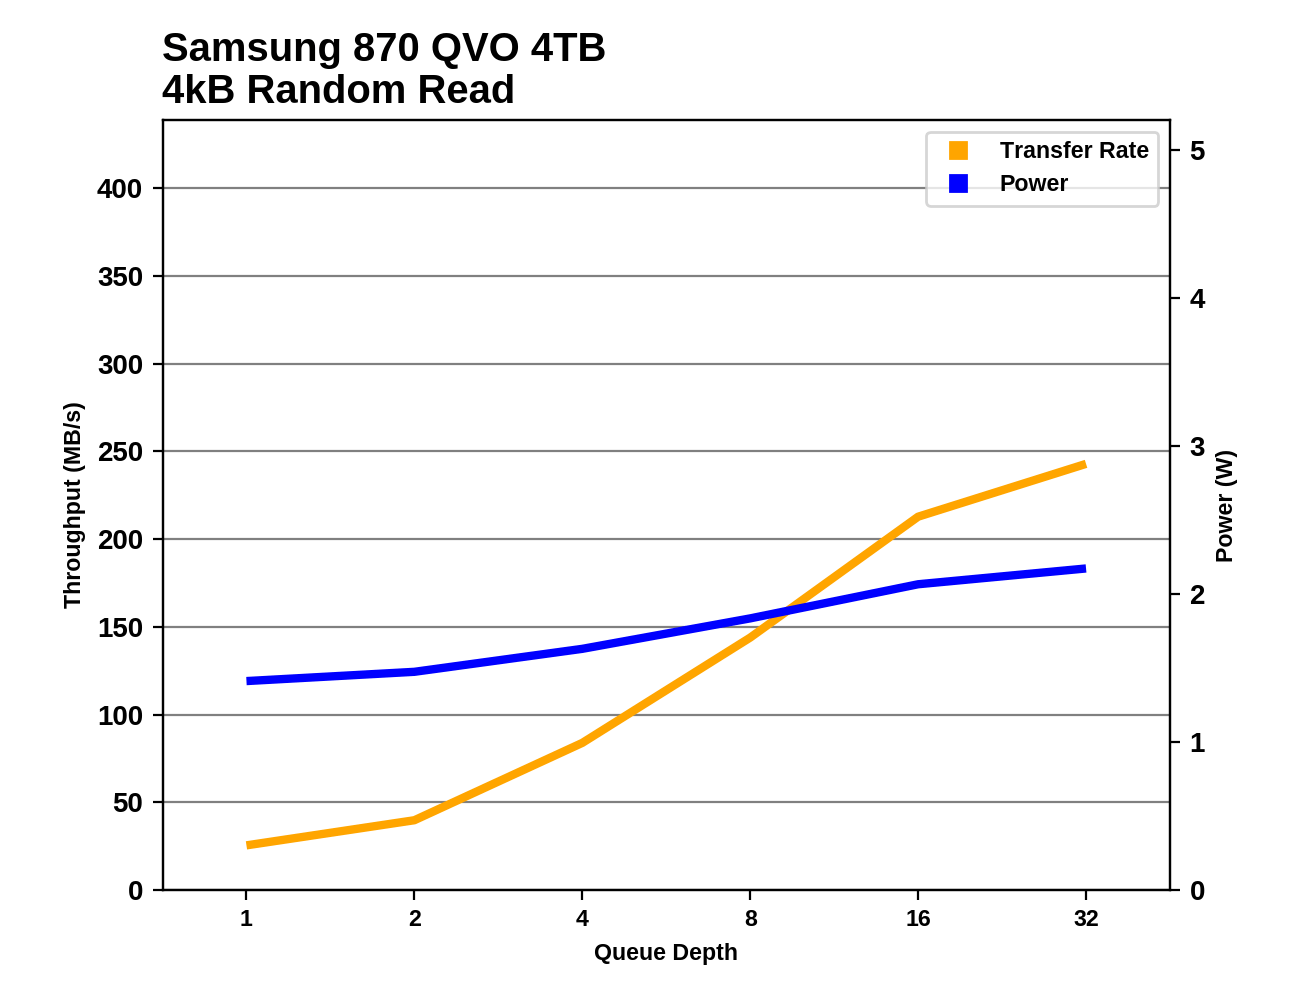
Looking at the big picture of the 870 QVO against all the other drives we've tested shows that the 870 QVO can reach the same top speeds as most SATA drives for three out of the four workload types. Random reads are the exception, where even high queue depths don't bring the 870 QVO up to the SATA limits during our sustained test, and the power draw is clearly on the high side there as well.
 |
|||||||||
| Random Read | |||||||||
| Random Write | |||||||||
| Sequential Read | |||||||||
| Sequential Write | |||||||||
Compared to its predecessor, the 870 QVO brings slight improvements to random read performance, mainly at higher queue depths, while keeping power consumption almost unchanged. Random write performance has changed drastically for the 1TB QVO: the 1TB 870 is able to ramp up to much higher random write speeds, keeping pace with the 4TB model until the very end of the test when the smaller drive's cache finally runs out in spite of the idle time between phases of the test. The older 1TB 860 QVO's random write speed was constrained almost from the very beginning of the test. The 1TB 860 QVO also used to show a bit of fall-off in sequential read performance as the test reached higher capacities, and that behavior is gone with the 870 QVO. Sequential writes show a similarly drastic improvement for the 1TB 870 QVO, now able to generally keep pace with the larger model, which was not remotely the case for the previous generation.
Some of the big differences in write speed shown for the 1TB QVOs here may be an artifact of this test's size and duration, but even so it is clear that the smallest QV


64 Comments
View All Comments
Jorgp2 - Tuesday, June 30, 2020 - link
That HDD is also CMR.A normal HDD would perform much better.
Daeros - Tuesday, June 30, 2020 - link
CMR is Conventional Magnetic Recording - you're thinking of SMR (Shingled Magnetic Recording), which this drive does not use.Sivar - Tuesday, June 30, 2020 - link
Valid argument in 2020: "I replaced my 1TB SSD with a 7200RPM hard drive to reduce write latency, improve durability, and reduce costs by half."ballsystemlord - Tuesday, June 30, 2020 - link
Spelling and grammar errors:"All of the QLC drives require substantially more energy to complete The Destroyer than mainstream TLC drives, and one of the DRAMless TLC drives comes out wa"
You were saying?
"Some of the big differences in write speed shown for the 1TB QVOs here may be an artifact of this test's size and duration, but even so it is clear that the smallest QV"
You were saying?
zachj - Tuesday, June 30, 2020 - link
Why not compare to the 4TB Western Digital Red WDS400T1R0A SATA SSD? That would seem to be a somewhat reasonable comparison...Billy Tallis - Tuesday, June 30, 2020 - link
The WD Red SSD is basically the WD Blue SSD with SLC caching turned off, which makes it a less relevant point of comparison. And I don't have a 4TB sample of either of those products.zachj - Tuesday, June 30, 2020 - link
The WD Red ssd has an endurance rating (terabytes written) literally 4x higher--2500 versus 600--than the WD Blue drive. I don't have any data on which to disagree with your assertion that red and blue drives are mechanically identical but I think the difference in endurance is highly relevant given that one of two major pitfalls of QLC drives is endurance...NoSoMo - Wednesday, July 1, 2020 - link
As tests have shown the endurance rating is for the most part hot air -- SSDs can easily exceed that threshold many times over. Sure you can pay more in a drive to get a warranty, but you can also just buy the same drive w/ cache for less....... Warranties after all are BIG business with profits in the 80+ percentile range.Oxford Guy - Tuesday, June 30, 2020 - link
QLC is the kind of product that companies like and consumers shouldn't.It's one of the instances where the product serves the seller more than the buyer.
Another example is the fiction known as the contemporary console (really a PC with a rubbish walled garden so everyone has to pay extra for extra drawbacks).
eek2121 - Wednesday, July 1, 2020 - link
It’s mostly due to the Samsung tax. I expect that, with some effort, it is possible to put out a decent performing 4TB QLC drive for $200. However, that means broad adoption of QLC. Thus far it seems TLC is the favorite.