The Dell XPS 13 (9300) Review: Return of the King
by Brett Howse on July 16, 2020 10:00 AM ESTDisplay Analysis
Dell’s move back to 16:10 on their XPS laptop display panels is likely a welcome change for almost all prospective buyers. The PC industry aggressively moved to 16:9 with the rise of HD televisions, and while the 16:9 aspect ratio is still the default for most PC gaming and media consumption, most productivity tasks will enjoy the slightly taller display. Going to 16:10 instead of 3:2 like we have seen on Microsoft’s Surface lineup is also a nice compromise between productivity and consumption.
Dell is offering both 1920x1200 and 3840x2400 display offerings, which is in-line with what they’ve been doing with the XPS 13 lineup since at least 2015. For 2020 though, there is an optional touch digitizer on the lower resolution display, whereas in the past Dell only included touch with the higher-resolution panel. Both displays offer Dolby Vision processing and Eyesafe technology to reduce blue light transmission.
The 1920x1200 panel is a standard sRGB display, rated at 500 nits of brightness. Meanwhile the 3840x2400 panel has a much wider color gamut – offering 90% of the P3 color space – and is HDR 400 certified as well.
Dell sampled us the lower-resolution panel for review, but as with any Windows-based notebook with wider than sRGB gamut coverage, it is still a 'buyer beware' situation. Windows 10 does not offer the best color management system, and since almost all content and programs are designed around sRGB, if you opt for the wider-gamut display colors will be blown out unless you are using an application that specifically supports color management. For most people, the sRGB panel is the better option, not only because the 1920x1200 13.4-inch display still provides a reasonable 170 pixels-per-inch and much better battery life, but also because Windows still deals with wide-gamut and HDR poorly.
One area where Dell needs to be commended though is in their use of anti-glare coatings on their XPS displays. This has been one area that no PC manufacturer has really put much effort in, but Dell offers a 0.65% reflectivity rating on their coating, and it makes a big difference in day-to-day usage, especially in a bright room or outdoors.
To see how the XPS 13 display performs, it was tested using the Portrait Displays CalMAN software suite, using a custom workflow. Brightness and contrast were measured with the X-Rite i1Display Pro colorimeter, and color accuracy measurements were done with the X-Rite i1Pro2 spectrophotometer.
Brightness and Contrast
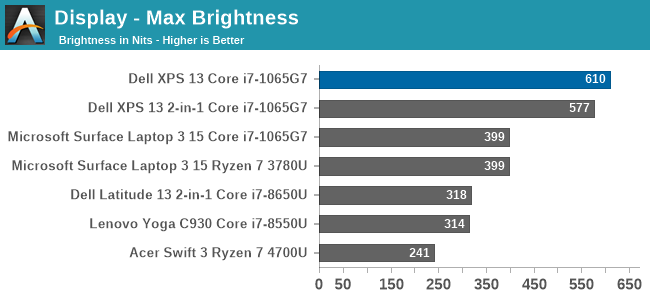
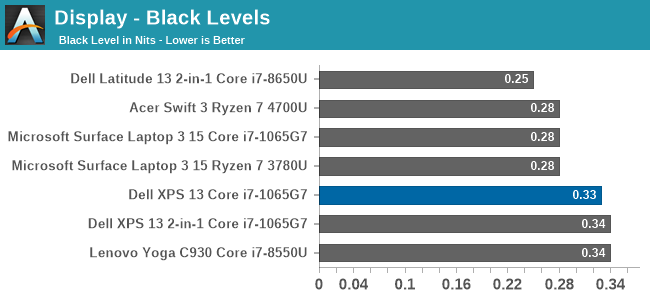
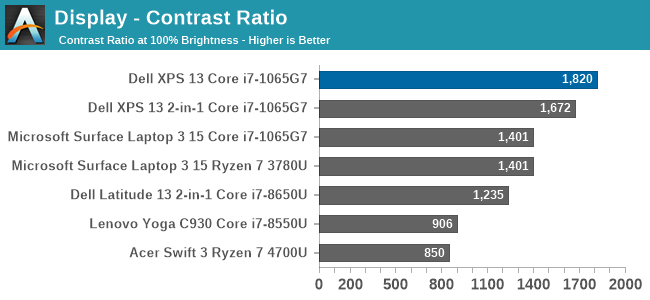
Despite the 500-nit rating, the XPS 13 managed to achieve a very impressive 610 nits of brightness. Coupled with the excellent anti-reflective coatings, the XPS 13 is easily one of the best notebooks for any bright location. The contrast ration of over 1800:1 was also top-notch.
Grayscale
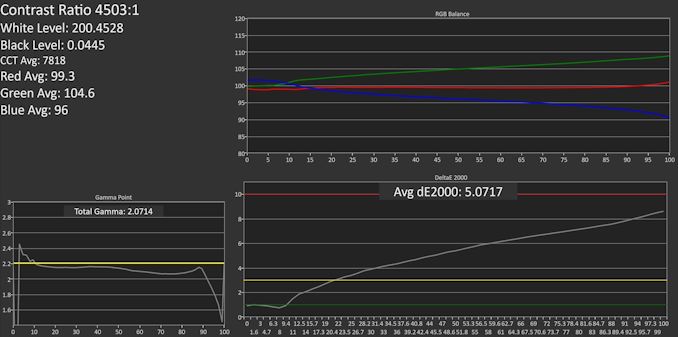
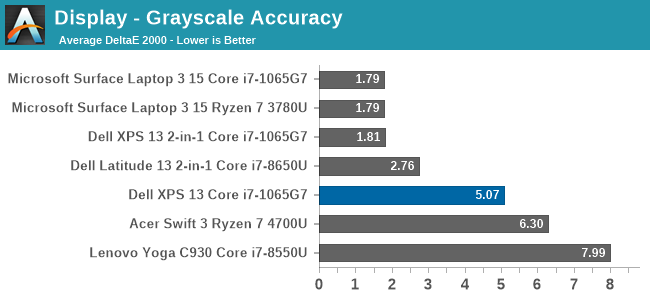
Despite the XPS 13 including an ICC profile, the review unit offered very poor grayscale performance, which was a disappointment after the XPS 13 2-in-1 we reviewed in November had such great results. Dell is likely using a batch-calibration process, rather than tuning each panel individually, which is a shame.
Gamut
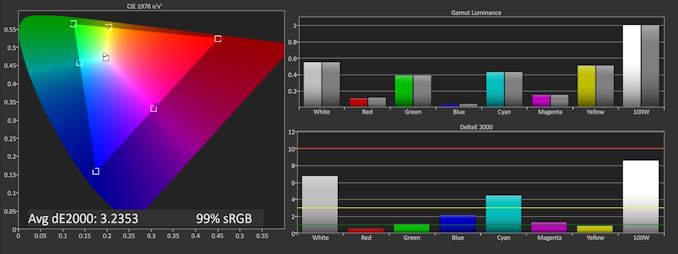
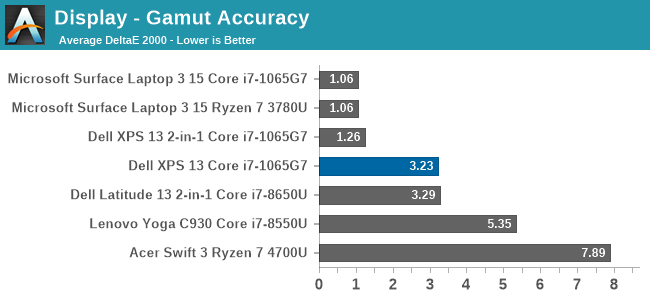
Grayscale aside, the color gamut results show a much better outcome, with really only Cyan having much in the way of color error. The display nicely hits sRGB primary and secondary color points, although does pull a bit to the green end, especially on Cyan.
Saturation
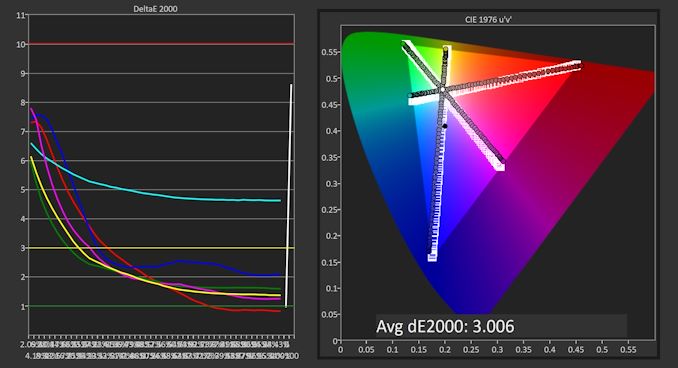

Gamut tests the sRGB color space at the 100% levels, but for the saturation test each primary and secondary color is tested in 4-bit steps from 0% to 100%. Really, other than the Cyan errors, the XPS 13’s color accuracy on these sweeps is quite good, just missing the 3.0 DeltaE threshold.
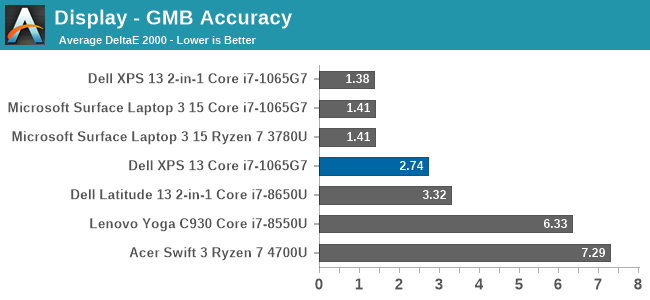
Gretag Macbeth
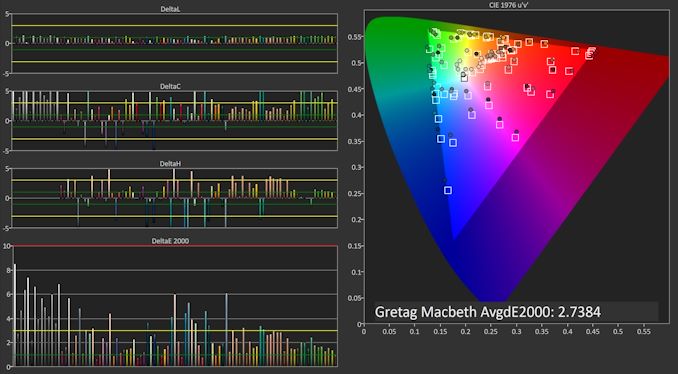
The Gretag Macbeth colorchecker tests many colors, not just the primary and secondary colors, and includes the important skin tones. To be considered accurate, all of the color tests on the DeltaE 2000 scale should be under the yellow line, and for the most part that is the case. The grayscales and the most impacted, which isn’t surprising with how inaccurate the grayscale was on this unit, with only a few colors over the 3.0 error level.
Colorchecker
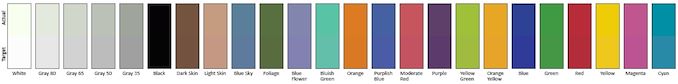
The colorcheck swatch provides a relative look at how the display performs. The colors on the bottom half of the swatch are the targeted colors, and the top half is what the XPS 13 was able to provide. This is a relative result, because any error in your own display would impact this swatch.
For the most part, the color accuracy of the XPS 13 is very good, with mostly only grayscale errors. The bad news is that Dell did include an ICC profile to address this, but it had little to no impact on the grayscale. Meanwhile the good news is that since most of the errors are grayscale, if you owned your own calibration tools, the XPS 13 could be adjusted to give a reasonable result. But as a premium device, it would be nice to see Dell extend the calibration to every panel.


224 Comments
View All Comments
Deicidium369 - Friday, July 17, 2020 - link
I agree. OEMs will build what their customers want. I just don't see people clamoring for an AMD over an IntelKorguz - Friday, July 17, 2020 - link
of course you dont, cause you can only see intel, no matter what.vladx - Saturday, July 18, 2020 - link
No we can certainly see AMD with how they fail time and time again to launch reliable products and platforms.Korguz - Saturday, July 18, 2020 - link
seems your god intel seems to be failing quite a lot the last few years.vladx - Saturday, July 18, 2020 - link
Sorry that you're so butthurt that you try to mock others, Intel sells best because they are very reliable unlike AMD.Korguz - Saturday, July 18, 2020 - link
sorry you are butthurt cause your god intel has screwed up so bad the last few years, and that you blind to see anything else.rhysiam - Thursday, July 16, 2020 - link
Oh come on, this cherry picked "17%" claim again? See my post above. The very review you are commenting on shows highly threaded workloads pushing to AMD's advantage in the 34% to 79% range, depending on the specific workload. That is **not** "virtually matching"... and the 4700U is **not** the top Renoir.Deicidium369 - Friday, July 17, 2020 - link
"Summing up the performance metrics, the Intel Core i7-1165G7 has a lead of up to 20% in single-core performance tests while featuring a 10% clock speed advantage over the Ryzen 7 4800U (4.2 GHz vs 4.7 GHz). In multi-core tests, the Ryzen 7 4800U is 17% faster but that is despite the AMD chip having twice the number of cores and threads. But that's the fastest score for the chip with Linux OS which tends to offer higher scores. Compared to a Ryzen 7 4800U on Windows OS, the Core i7-1165G7 leads by up to 35% in single-core while being just 6% slower than its 8 core & 16 thread competitor."https://wccftech.com/intel-10nm-core-i7-1165g7-cpu...
34% higher performance in single core - slightly higher clock, but not 34% higher clocks - that's a nice IPC gain.
Not seeing the 34 to 79% AMD advantage in multicore. I am seeing the multicore being between 17% slower and 6% slower depending on the OS - with 8 cores & 16 threads vs 4 cores and 8 threads.
Just so we are working from the same materials.
Korguz - Friday, July 17, 2020 - link
yea, wccftech is a trust worthy source, arent they mostly a rumor/BS site ?Spunjji - Monday, July 20, 2020 - link
WCCFTech were running with rumours that Zen 2 would hit ~5Ghz for months before it was released, so yeah, I'd say their record isn't particularly reliable.Their comments section is also notoriously full of trolls and jackasses...