GLBenchmark 2.0 Released - Modern SoCs Benchmarked
by Brian Klug on December 17, 2010 2:08 AM EST- Posted in
- Smartphones
- GLBenchmark
- Mobile
- SoCs
We're constantly on the lookout for new benchmarks to use for benchmarking the latest SoCs in devices. Today, Kishonti Informatics released GLBenchmark 2.0, the latest version of its popular GLBenchmark suite for measuring 3D graphics performance across a host of platforms: iOS, Android, Symbian, Windows Mobile, and Maemo. We've been testing it out for a while now and have some numbers of our own and from the community results. The end result is yet another look at how 3D performance stacks up between nearly all modern SoCs.
GLBenchmark 2.0 - as its name implies - tests OpenGL ES 2.0 performance on compatible devices. The suite includes two long benchmarking scenarios with a demanding combination of OpenGL ES 2.0 effects, and individual tests such as swap buffer speed (for determining the framerate cap), texture fill, triangle, and geometric tests. GLBenchmark 2.0 also leverages texture based and direct lighting, bump, environment, and radiance mapping, soft shadows, vertex shader based skinning, level of detail support, multi-pass deferred rendering, noise textures, and ETC1 texture compression.

We've been testing devices for a little while now and have a decent enough spread to make for some interesting comparison. The only extra consideration is that all of these were run at the device's respective native resolution. There's no way to change resolution, and likewise numbers cannot be scaled linearly because we may be memory bandwidth limited on some devices. GLBenchmark will join our benchmark suite for devices going forward.
First are the resolutions (native) of the devices themselves:
| Device Resolutions - GLBenchmark Native Resolution | |||||
| Google Nexus One | 800x480 WVGA | ||||
| LG Optimus One | 320x480 HVGA | ||||
| T-Mobile myTouch 4G | 800x480 WVGA | ||||
| Samsung Fascinate | 800x480 WVGA | ||||
| Google Nexus S | 800x480 WVGA | ||||
| HTC EVO 4G | 800x480 WVGA | ||||
| Apple iPhone 4 | 960x640 DVGA | ||||
| Apple iPad | 1024x768 XGA | ||||
| Motorola Droid | 854x480 FWVGA | ||||
| T-Mobile G2 | 800x480 WVGA | ||||
| Nokia N900 | 800x480 WVGA | ||||
| Apple iPhone 3GS | 320x480 HVGA | ||||
Thankfully, comparison across devices running Android is easy thanks to the relatively standard WVGA resolution guidelines for high end devices.
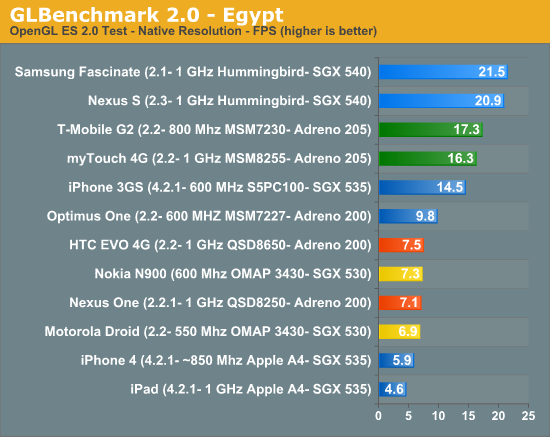
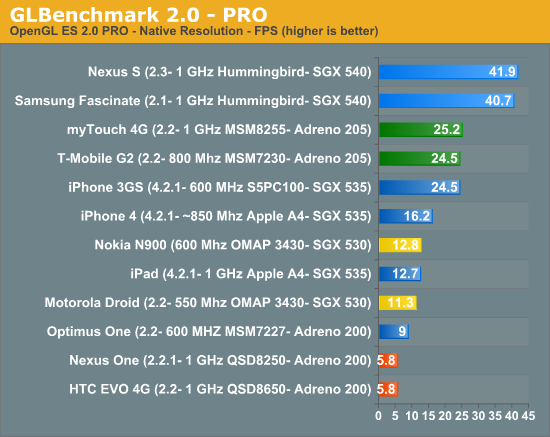
The first benchmark, Egypt, tests OpenGL ES 2.0 and represents the newest and most demanding benchmark. The second - GLBenchmark PRO - represents a suite that tests OpenGL ES 1.1 performance. (edit: GLBenchmark Pro also tests OpenGL ES 2.0 features, and is a port of an earlier GLBenchmark 1.1 test which focused on OpenGL ES 1.1 performance). Moving forward we will report these whenever possible on smartphone reviews.


It's pretty apparent right now that PowerVR SGX 540 still holds the lead, though the new 45 nm Qualcomms with Adreno 205 are a huge jump forwards from Adreno 200 performance wise. It's interesting that it looks like we're GPU or memory bandwidth bound on those new Qualcomms, as evidenced by the similar results the myTouch 4G and G2 post despite a 200 MHz CPU clock disparity.
Overall, GLBenchmark is designed to showcase some of the OpenGL ES 2.0 features that developers may potentially use in future gaming titles. There are a lot more low level tests which we'll be playing around with in the future and using to test in much more detail.


64 Comments
View All Comments
Shadowmaster625 - Friday, December 17, 2010 - link
We need to see the benchmark results adjusted for screen resolution. The simplest way to do it is take the screen resolution and multiply the X and the Y and then multiply that by the FPS score then divide by 1 million.For example, the iPad 4 scored 4.6 and has a resolution of 1024x768. So the "real" score would be 1024 x 768 x 4.6 / 1000000 = 3.62. And the 3GS is 320x480x14.5/1000000 = 2.23. By doing this we will easily see in the graphs that the iPad is 62% faster than the 3GS.
7Enigma - Friday, December 17, 2010 - link
The problem with this (unlike desktop/laptop computers) is that the phone is going to run native resolution ALL the time. You can't simply lower the res and get better performance, so while the numbers are skewed, I'd argue they are accurate.What obviously has to happen then is games made for a higher resolution device such as the iPhone4 will have to have lower-quality textures/effects to maintain playable while the lower res phones can have higher-quality textures/effects.
Similar to the current (or maybe a bit ago) desktop gaming where people with >24" monitors were having to keep some of the eye candy off (high levels of AA for instance) while those of us gaming on 19" screens could have everything maxed out. It's personal preference whether bigger (with less quality) is better.
vol7ron - Friday, December 17, 2010 - link
I totally agree that the numbers should be kept as is, since that is how they will be viewed. It's not theoretical figures we're trying to see, it's actual performance.It's important to note that certain devices have higher resolution, thus the fps may be affected, but the visual quality should seem better.
Though, it would be nice to have an indexed theoretical comparison as mentioned. Something that uses the lowest common denominator so we can compare the performance in terms of resolution. Of course, there are many factors that would affect this index (memory size, memory speed, gpu, cpu, available nand, screen type, screen resolution, etc), but since we're lumping the memory/gpu/cpu all into one category, the resolution is the only other variable that will mostly affect the performance. - I'm curious to see what kind if a correlation truly does exist.
therealnickdanger - Friday, December 17, 2010 - link
From the first test, using your methodology, it certainly does shake up the list a bit...Samsung Fascinate 8.3, Google Nexus S 8.0 top out the list.
therealnickdanger - Friday, December 17, 2010 - link
Dumb spam filter...T-Mobile G2 6.6, T-Mobile myTouch 4G 6.3 seem comparable.
therealnickdanger - Friday, December 17, 2010 - link
Apple iPhone 4 3.6, Apple iPad 3.6 are identical... big surprise!therealnickdanger - Friday, December 17, 2010 - link
OK, apparently I can't post any more of my "spam".Anyway, it would be good of AT to normalize the benchmarks for resolution. It seems like the only fair way to compare them. Of course, the raw data is important as well, but quadrupling resolution is certainly an important distinction.
I'm running the full suite on my LG Optimus S right now and it's doing pretty well - much better Egypt score than the Optimus One.
therealnickdanger - Friday, December 17, 2010 - link
Sprint LG Optimus S - root, but stock ROM, no OC:Egypt: 14.6fps
Egypt FSAA: 12.8fps
But then it crashed trying to upload results. Oh well, the site thinks my phone is a Optimus One (similar, but not identical), so it's probably best that I don't upload my scores.
zorxd - Friday, December 17, 2010 - link
It actually is. The iPad has a better CPU so should be faster. However it has less RAM. But it's surprising that they get the exact same score.Shadowmaster625 - Friday, December 17, 2010 - link
lol does it think you are trying to sell something? Like that chinese spammer who kept posting t-shirts 5, shoes 9 bla bla bla