AMD Radeon R7 SSD (240GB) Review
by Kristian Vättö on August 28, 2014 6:00 AM ESTRandom Read/Write Speed
The four corners of SSD performance are as follows: random read, random write, sequential read and sequential write speed. Random accesses are generally small in size, while sequential accesses tend to be larger and thus we have the four Iometer tests we use in all of our reviews.
Our first test writes 4KB in a completely random pattern over an 8GB space of the drive to simulate the sort of random access that you'd see on an OS drive (even this is more stressful than a normal desktop user would see). We perform three concurrent IOs and run the test for 3 minutes. The results reported are in average MB/s over the entire time.
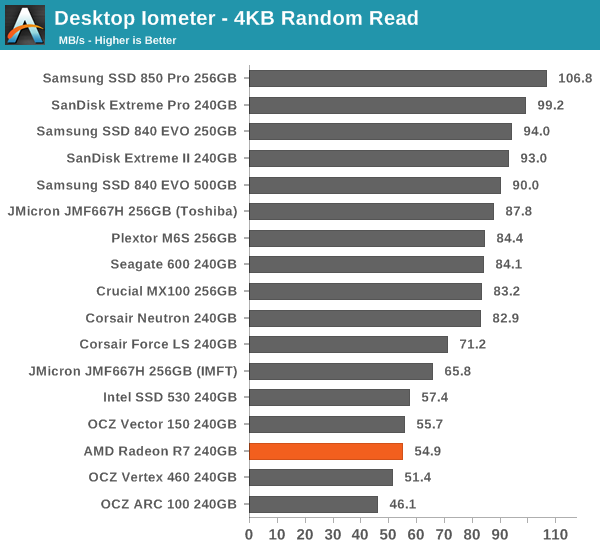
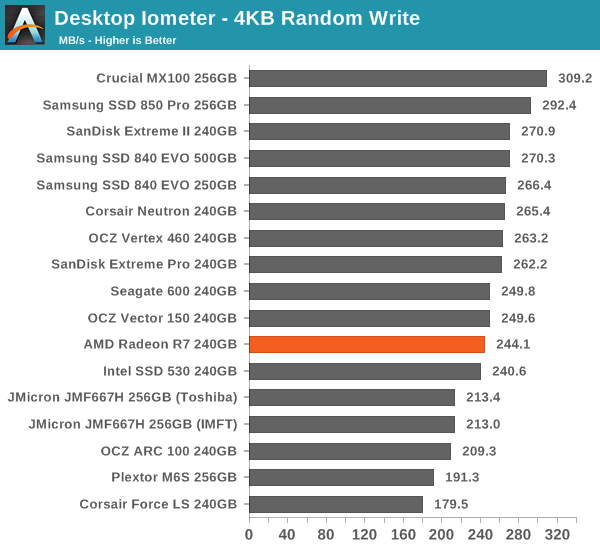
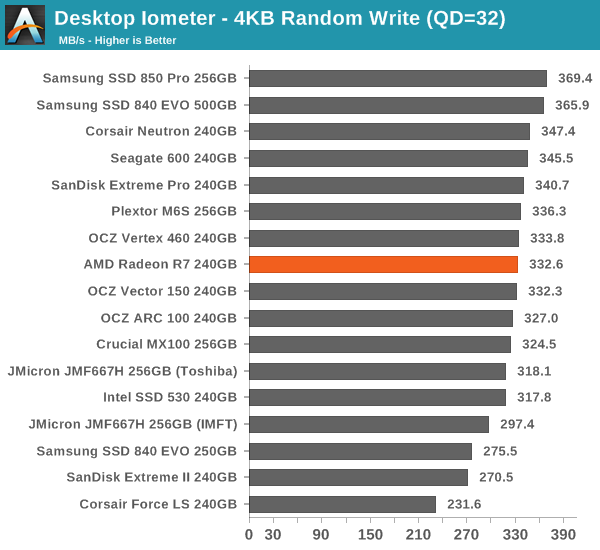
Random performance remains similar to other Barefoot 3 SSDs. Peak performance has never been Barefoot 3's strength, which is why especially random read performance seems slow for a modern drive, but the lack of peak performance is compensated by sustained consistency.
Sequential Read/Write Speed
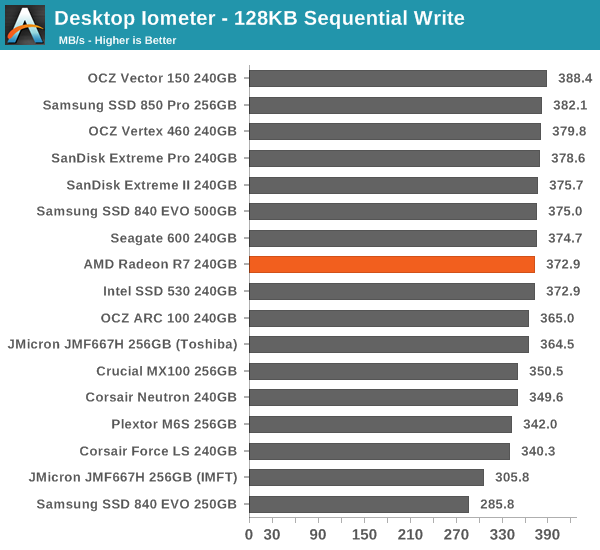
To measure sequential performance we run a 1 minute long 128KB sequential test over the entire span of the drive at a queue depth of 1. The results reported are in average MB/s over the entire test length.
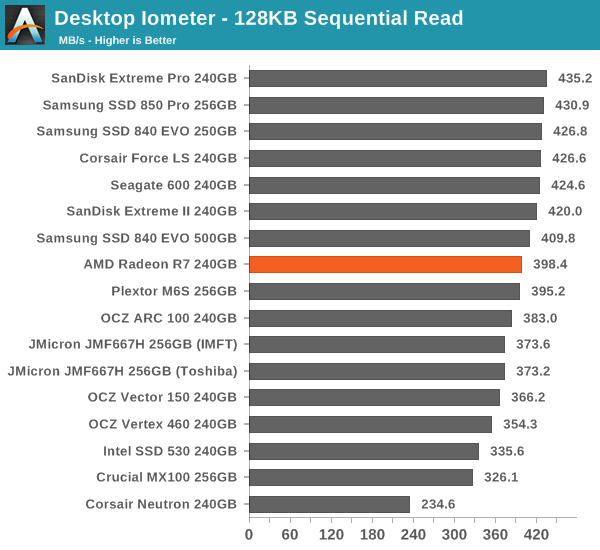
Sequential read performance receives a nice upgrade from the Vector 150 and Vertex 460, although that comes at the cost of sequential write speed. It is quite common that an increasing in one benchmark leads to a decrese in another as in the end firmware design is about finding the right balance for IO priorization.
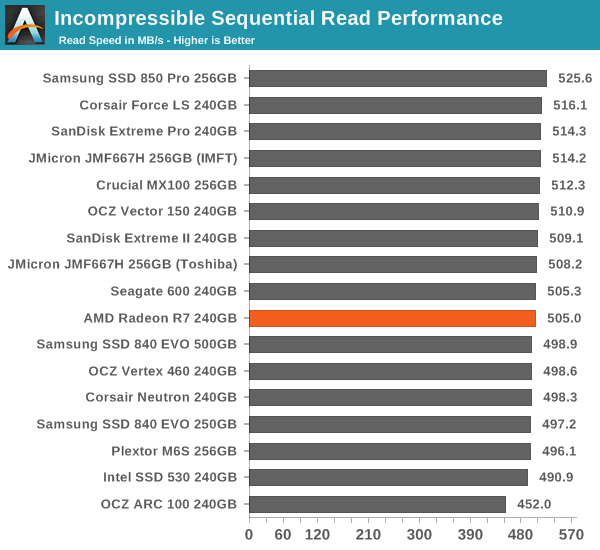
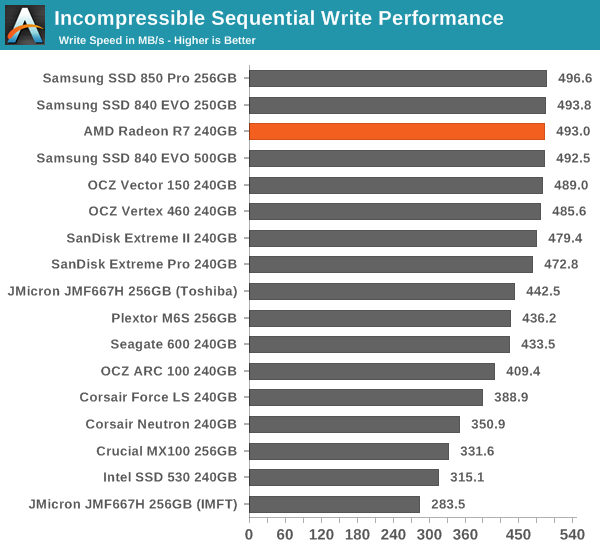
AS-SSD Incompressible Sequential Read/Write Performance
The AS-SSD sequential benchmark uses incompressible data for all of its transfers. The result is a pretty big reduction in sequential write speed on SandForce based controllers, but most other controllers are unaffected.


54 Comments
View All Comments
R 0 G - Tuesday, October 7, 2014 - link
I don't know why the samsung 840 Pro is absent form the benchies comparaison SSD list ! which would be the most interesting one !I Owns 3 SSD from OCZ and a beautiful old school golden DDR3 1600, none of them failed, Agility 3 240 GB was bought 3 years ago for 140 bucks when SSD s were very expensive and was already achieving 550 mbps transfer speeds, few BSODS though.
andrewbaggins - Monday, November 10, 2014 - link
Power Consumption charts are incomplete. SSDs spend most of their time in an Idle state. Your charts would be more helpful if they included simple Idle state power consumption. After all, millions of laptops and notebooks in everyday use do not have dev-slp or other advanced power options of the latest models, and those owners would be well-served knowing, for example, that a Samsung EVO draws much, much less power when idling compared to a Corsair Neutron GTX or Vertex 4, etc.andrewbaggins - Friday, May 15, 2015 - link
OCZ went broke because they had to replace a huge, HUGE number of faulty drives, and many of those had to be replaced a second time! Cash flow could NOT sustain such overheads, and using their customers as guinea pigs for SSDs with half-baked controllers won them few admirers among bankers asked to back them when things started spinning out of control. MAYBE their drives are OK now and MAYBE they are much reliable, but those who were once/twice bitten are right to be twice/thrice shy of OCZ.Leyawiin - Saturday, September 12, 2015 - link
$99 now at Amazon. For the performance it has, warranty and accessories that's a pretty decent deal.