ASRock Rack C2750D4I and U-NAS NSC-800: A DIY File Server
by Ganesh T S on August 10, 2015 8:45 AM EST- Posted in
- NAS
- storage server
- Avoton
- ASRock Rack
- U-NAS
Performance Metrics - Phoronix Test Suite
The file server's BIOS settings allow it boot off a USB key. We had no trouble doing the same with a portable installation of Ubuntu 14.04 (kernel version 3.16).
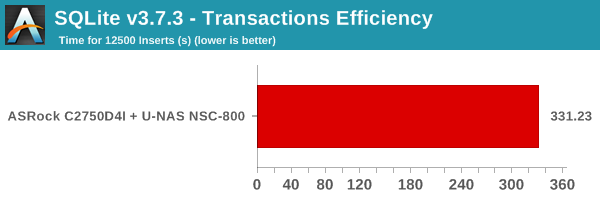
Database Benchmarks
The first test we look at involves determination of the time taken to perform 12500 record insertions into an indexed database. We use SQLite v3.7.3. SQLite performance depends to a large extent on the capabilities of the CPU. Benchmarks from other systems can be viewed on OpenBenchmarking.org.
The pgbench database benchmark involves recording the transaction rate for database operations using PostgreSQL. Unlike SQLite insertions-only test, pgbench is based on TPC-B, running five SELECT, UPDATE and INSERT commands per transaction.
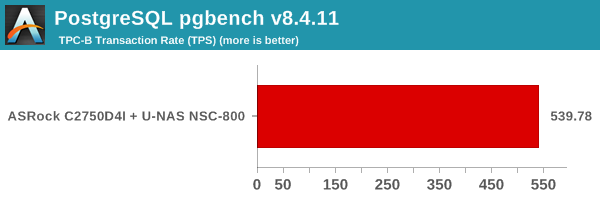
Benchmarks from other systems can be viewed on OpenBenchmark.org
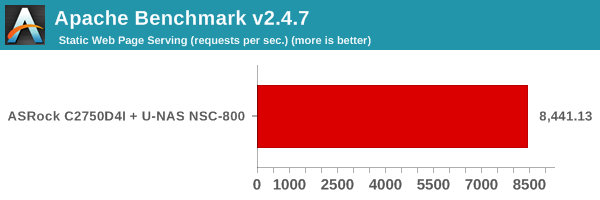
Web Server Benchmarks
The NGINX and Apache benchmarks record the number of static web page requests that can be serviced in a given time interval. It gives an idea of the load that can be handled if a given system were to be configured as a web server. The test load consists of a total of 500K requests (for NGINX) / 1M requests (for Apache) with 100 concurrent ones.

Benchmark numbers for both of these are available on OpenBenchmarking.org (NGINX, Apache).
TCP Loopback
The efficiency of the networking stack in the system (not to be confused with the hardware network adapter itself) can be determined by measures the loopback TCP performance. We record the time taken to transfer 10GB of data via loopback.
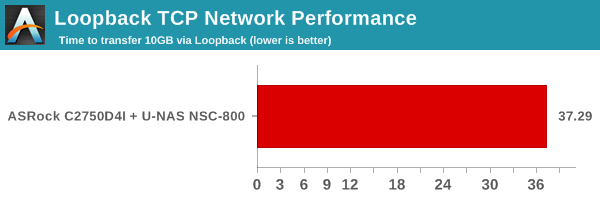
Given that we have the same networking stack for a given OS release across different hardware configurations, the efficiency is going to vary based solely on the CPU capabilities again. Benchmarks from other systems can be viewed on OpenBenchmarking.org.
CacheBench
CacheBench is an artificial benchmark to determine the performance of the cache and DRAM components in a system. It consists of three profiles - reads, writes and read/modify/writes. The bandwidth is recorded for each profile, with bigger numbers indicating better performance.
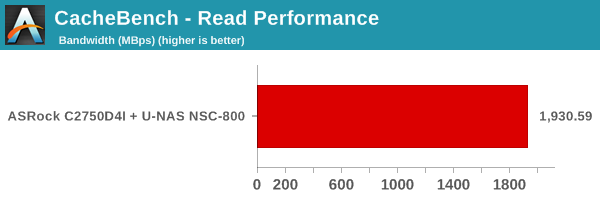
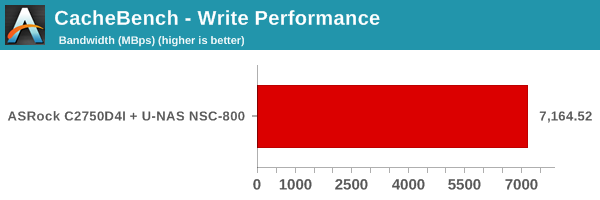
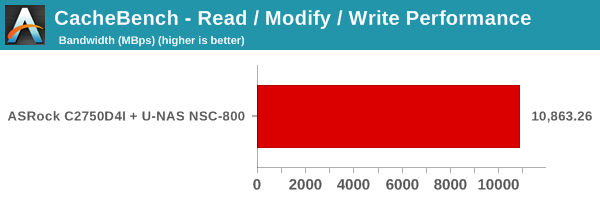
The numbers depend on the internal cache access speeds as well as the speed of the DRAM in the system. Benchmarks from other systems can be viewed on OpenBenchmarking.org
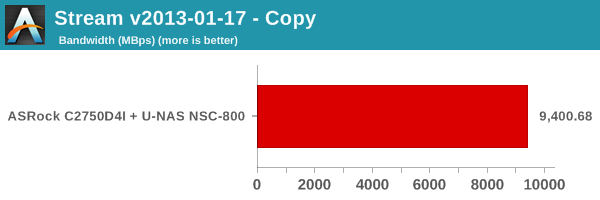
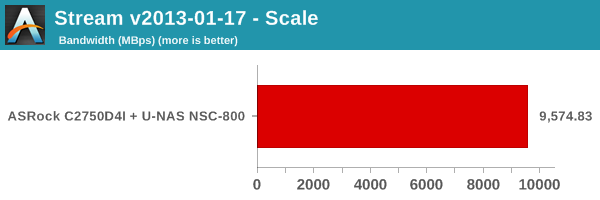
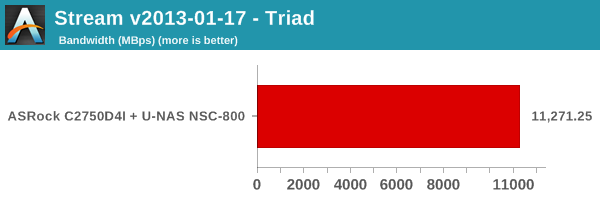
Stream
The system memory is tested out using the stream benchmark. The STREAM benchmark is a simple, synthetic benchmark designed to measure sustainable memory bandwidth (in MB/s) and a corresponding computation rate for four simple vector kernels (Copy, Scale, Add and Triad).

7-Zip Compression
The 7-Zip compression benchmark records the MIPS for the compression mode. This is the same benchmark that we use in the evaluation of mini-PCs, except that this is based on the Linux version. Higher MIPS ratings correspond to better performance, and the numbers are primarily based on the performance of the CPU in the system.
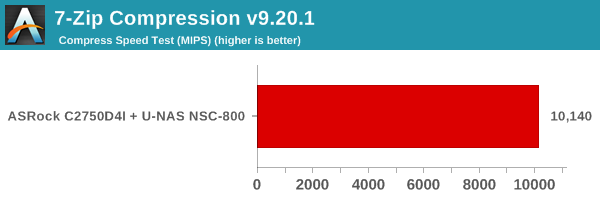
Benchmark numbers for other systems can be viewed on OpenBenchmarking.org
Linux Kernel Compilation
The timed Linux kernel compilation benchmark records the time taken to build the Linux 3.18 kernel. It is a good multi-discipline benchmark, stressing multiple aspects of the system including the DRAM, CPU and, to a certain extent, even the storage.
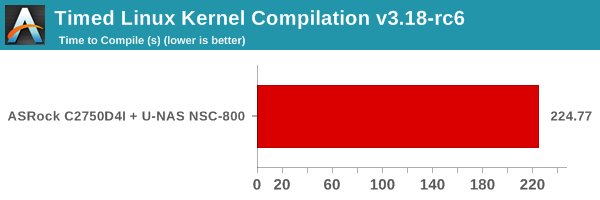
Benchmark numbers for other systems can be viewed on OpenBenchmarking.org
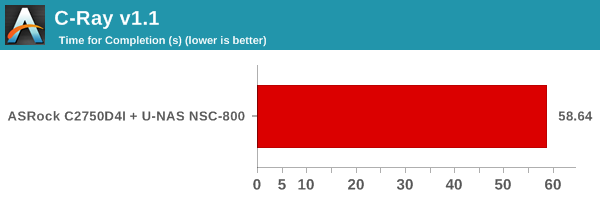
C-Ray
C-Ray is a simple raytracer designed to evaluate the floating point performance of a CPU. This is a multi-threaded test, and the time taken to complete the routine is recorded.
Benchmark numbers for other systems can be viewed on OpenBenchmarking.org


48 Comments
View All Comments
xicaque - Monday, November 23, 2015 - link
Can you elaborate on redundant power supplies? Please? What is their purpose?nxsfan - Tuesday, August 11, 2015 - link
I have the ASRack C2750d4i + Silverstone DS380, with 8x3.5" HDDs and one SSD (& 16GB ECC). Your CPU and MB temps seem high, particularly when (if I understand correctly) you populated the U-NAS with SSDs.If lm-sensors is correct my CPU cores idle around 25 C and under peak load get to 50 C. My MB sits around 41 C. My HDDs range from ~50 C (TOSHIBA MD04ACA500) to ~37 C (WDC WD40EFRX). "Peak" (logged in the last month) power consumption (obtained from the UPS - so includes a 24 port switch) was 60 W. Idle is 41 W.
The hardware itself is great. I virtualize with KVM and the hardware handles multiple VMs plus multiple realtime 1080p H.264 transcodes with aplomb (VC-1 not so much). File transfers saturate my gigabit network, but I am not a power user (i.e. typically only 2-3 active clients).
bill.rookard - Tuesday, August 11, 2015 - link
I really like this unit. Compact. Flexible. Well thought out. Best of all, -affordable-. Putting together a budget media server just became much easier. Now to just find a good itx based mobo with enough SATA ports to handle the 8 bays...KateH - Tuesday, August 11, 2015 - link
Another good turnkey solution from ASRock, but I still think they missed a golden opportunity by not making an "ASRack" brand for their NAS units ;)e1jones - Wednesday, August 12, 2015 - link
Would be great for a Xeon D-15*0 board, but most of the ones I've seen so far only have 6 sata ports. A little more horsepower to virtualize and run CPU intensive programs.akula2 - Monday, August 17, 2015 - link
>A file server can be used for multiple purposes, unlike a dedicated NAS.Well, I paused reading right there! What does that mean? You should improve on that sentence; it could be quite confusing to novice members who aspire to buy/build storage systems.
Next, I don't use Windows on any Servers. I never recommend that OS to anyone either, especially when the data is sensitive be it from business or personal perspective.
I use couple of NAS Servers based on OpenIndiana (Solaris based) and BSD OSes. ZFS can be great if one understands its design goals and philosophy.
I don't use FreeNAS or NAS boxes such as from Synology et al. I build the Hardware from the scratch to have greater choice and cost saving factors. Currently, I'm in Alpha stage building a large NAS Server (200+ TB) based on ZoL (ZFS on Linux). It will take at least two more months of effort to integrate to my company networks; few hundreds of associates based in three nations work more closely to augment efficiency and productivity.
Yeah, few more things to share:
1) Whatever I plan I look at Power consumption factor (green), especially high gulping ones such as Servers, Workstations, Hydrib Cluster, NAS Server etc. Hence, I allocate more funds to address the Power demand by deploying Solar solutions wherever it is viable in order to save some good money in the long run.
2) I mostly go for Hitachi SAS drives and SATA III about 20% (Enterprise segment).
3) ECC memory is mandatory. No compromise on this one to save some dough.
4) Moved away from Cloud service providers by building by private cloud (NAS based) to protect my employee privacy. All employee data should remain in the respective nations. Period.
GuizmoPhil - Friday, August 21, 2015 - link
I built a new server using their 4 bay model (NSC-400) last year. extremely sastisfied.Here's the pictures: https://picasaweb.google.com/117887570503925809876...
Below the specs:
CPU: Intel Core i3-4130T
CPU cooler: Thermolab ITX30 (not shown on the pictures, was upgraded after)
MOBO: ASUS H87i-PLUS
RAM: Crucial Ballistix Tactical Low Profile 1.35V XMP 8-8-8-24 (1x4GB)
SSD: Intel 320 series 80GB SATA 2.5"
HDD: 4x HGST 4TB CoolSpin 3.5"
FAN: Gelid 120mm sleeve silent fan (came with the unit)
PSU: Seasonic SS-350M1U
CASE: U-NAS NSC-400
OS: LinuxMint 17.1 x64 (basically ubuntu 14.04 lts, but hassle-free)
Iozone_guy - Wednesday, September 2, 2015 - link
I'm struggling to understand the test configuration. There seems to be a disconnect in the results. Almost all of the results have an average latency that is looking like a physical spindle, but yet the storage is all SSDs. How can the latency be so high ? Was there some problem with the setup, such that it wasn't measuring the SSD storage but something else ? Could the tester post the sfs_rc file and the sfslog.* and sfsc*.log files ? So we can try to sort out what happened ?