The Intel Broadwell Xeon E3 v4 Review: 95W, 65W and 35W with eDRAM
by Ian Cutress on August 26, 2015 9:00 AM ESTOffice Performance
Dolphin Benchmark: link
Many emulators are often bound by single thread CPU performance, and general reports tended to suggest that Haswell provided a significant boost to emulator performance. This benchmark runs a Wii program that raytraces a complex 3D scene inside the Dolphin Wii emulator. Performance on this benchmark is a good proxy of the speed of Dolphin CPU emulation, which is an intensive single core task using most aspects of a CPU. Results are given in minutes, where the Wii itself scores 17.53 minutes.
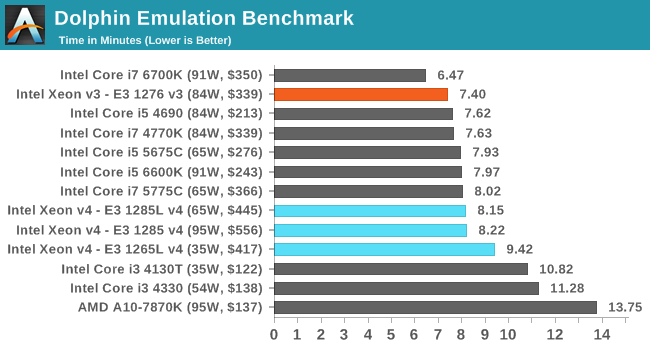
Dolphin prefers single threaded speed and IPC, which the extra frequency of the v3 wins out here. The disparity between the 65W/95W v4 processors and the 35W processor is most obvious here.
WinRAR 5.0.1: link
Our WinRAR test from 2013 is updated to the latest version of WinRAR at the start of 2014. We compress a set of 2867 files across 320 folders totaling 1.52 GB in size – 95% of these files are small typical website files, and the rest (90% of the size) are small 30 second 720p videos.
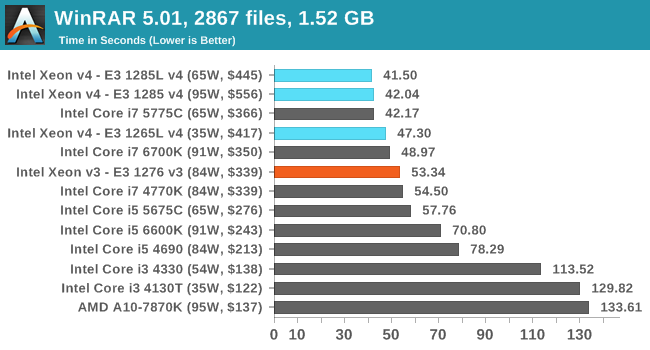
WinRAR is our classic 'eDRAM works here!' benchmark, clearly showing how Broadwell benefits. Although, one might argue that WinRAR is not a typical workload environment. It is also poignant to show that the 95W v4 doesn't win here in this variable-threaded load.
3D Particle Movement
3DPM is a self-penned benchmark, taking basic 3D movement algorithms used in Brownian Motion simulations and testing them for speed. High floating point performance, MHz and IPC wins in the single thread version, whereas the multithread version has to handle the threads and loves more cores.
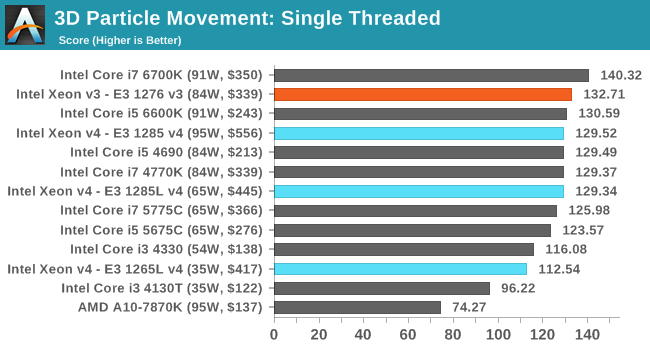
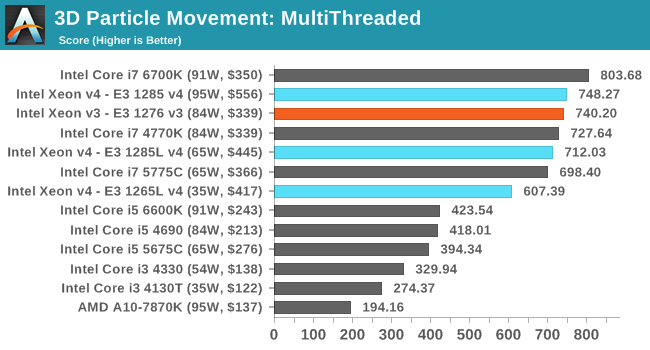
Similar to CineBench, in single threaded mode the v3 wins out due to the faster frequency, but in multithreaded mode the advancements in the Broadwell core due to better thread resource management puts at least the 95W v4 ahead.
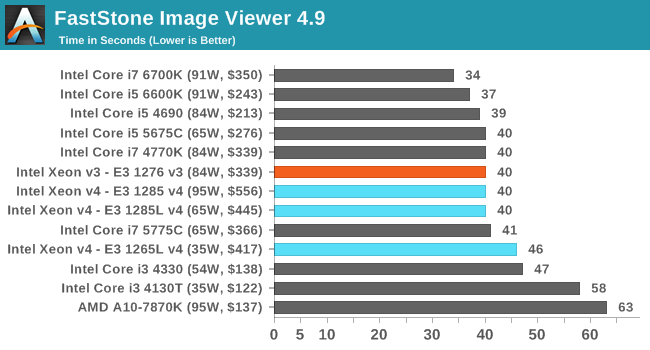
FastStone Image Viewer 4.9
FastStone is the program I use to perform quick or bulk actions on images, such as resizing, adjusting for color and cropping. In our test we take a series of 170 images in various sizes and formats and convert them all into 640x480 .gif files, maintaining the aspect ratio. FastStone does not use multithreading for this test, and results are given in seconds.
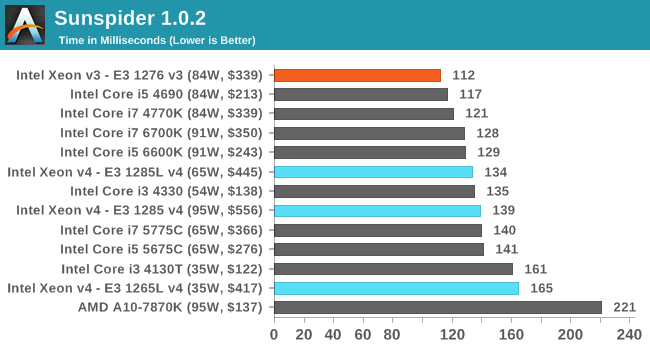
Web Benchmarks
On the lower end processors, general usability is a big factor of experience, especially as we move into the HTML5 era of web browsing. For our web benchmarks, we take four well known tests with Chrome 35 as a consistent browser.
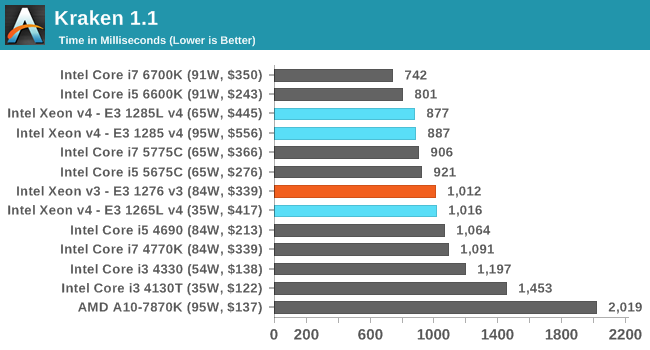
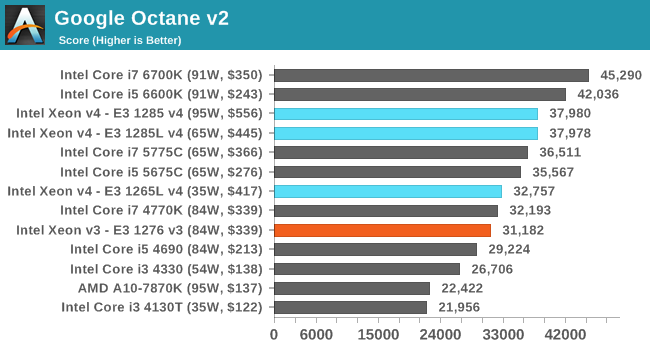
For web implementations, both Kraken and Octane see benefits moving up to Broadwell, but it is worth noting that moving to Skylake is an even better benefit. This again comes down to the management of CPU instructions between threads, and having benefits associated with keeping the knowledge of past instructions or information in lower cache levels. In would seem in this regard, if you count these benchmarks indicative of a real workload, that web-based throughput implementations are more in-flight operation limited than any other resource.


72 Comments
View All Comments
runciterassociates - Wednesday, August 26, 2015 - link
This is a server chip. Why are you benchmarking games?Furthermore, for SPEC, why are you using a dGPU when this chip has on die graphics?
Where are the OpenCL, OpenMP, GPGPU benchmarks, which are going to be the majority of how these will be used for green heterogeneous computing?
Gigaplex - Wednesday, August 26, 2015 - link
The E3 Xeons are more likely to be used in a workstation than a server.TallestJon96 - Wednesday, August 26, 2015 - link
They benchmark games because ignorant gamers (like myself) love to see gaming benchmarks for everything, even if they will never be used for games! If it was a 20 core Xeon clocked at 2ghz with hyper threading, we would want the benchmarks, even though they just show that everything i5 and up performs identically. We are a strange species, and you should not waste your time trying to understand us.Oxford Guy - Wednesday, August 26, 2015 - link
No benchmarks are irrelevant when they involve products people are using today. Gaming benchmarks are practical. However, that doesn't mean charts are necessarily well-considered, such as with how this site refuses to include a 4.5 GHz FX chip (or any FX chip) and instead only includes weaker APUs.Ian Cutress - Thursday, August 27, 2015 - link
As listed in a couple of sections of the review, this is because Broadwell-H on the desktop does not have an equivalent 84W part for previous generations and this allows us, perhaps somewhat academically, so see if there ends up being a gaming difference between Broadwell and Haswell at the higher power consumption levels.Jaybus - Friday, August 28, 2015 - link
Because, as stated in the article, the Ubuntu Live CD kernel was a fail for these new processors, so they couldn't run the Linux stuff.Voldenuit - Wednesday, August 26, 2015 - link
SPECviewperf on a desktop card?I'd be interested to see if a Quadro or FirePro would open up the gap between the CPUs.
mapesdhs - Thursday, August 27, 2015 - link
I was wondering that too; desktop cards get high numbers for Viewperf 12 because they cheat in the driver layer on image quality. SPEC testing should be done with pro cards where the relevance is more sensible. The situation is worse now because both GPU makers have fiddled with their drivers to be more relevant to consumer cards. Contrast how Viewperf 12 behaves with desktop cards to the performance spread observed with Viewperf 11, the differences are enormous.For example, tesing a 980 vs. a Quadro k5000 with Viewperf 11 and 12, the 980 is 3X faster than the K5000 for Viewperf 12, whereas the K5000 is 6x faster than the 980 for Viewperf 11. More than an order of magnitude performance shift just by using the newer test suite?? I have been told by tech site people elsewhere that the reason is changes to drivers and the use of much less image quality on consumer cards. Either way, it makes a nonsense of the usefulness of Viewperf if this is what's going on now. Otherwise, someone has to explain why the 980 compares so differently to a K5000 for Viewperf 11.
Ian Cutress - Thursday, August 27, 2015 - link
Both points noted. I'll see what I can do to obtain the professional cards.XZerg - Wednesday, August 26, 2015 - link
The gaming charts are messed up - igp performs faster than the dgpu on the SAME settings? i think something is wrong - most likely the labels of settings.Also it would have been better to compare IGP performance against the older versions of IRIS - where is 4770R? the point here is that while keeping the W similar, what are we really getting out of 14nm?