The Intel Broadwell Xeon E3 v4 Review: 95W, 65W and 35W with eDRAM
by Ian Cutress on August 26, 2015 9:00 AM ESTOffice Performance
Dolphin Benchmark: link
Many emulators are often bound by single thread CPU performance, and general reports tended to suggest that Haswell provided a significant boost to emulator performance. This benchmark runs a Wii program that raytraces a complex 3D scene inside the Dolphin Wii emulator. Performance on this benchmark is a good proxy of the speed of Dolphin CPU emulation, which is an intensive single core task using most aspects of a CPU. Results are given in minutes, where the Wii itself scores 17.53 minutes.
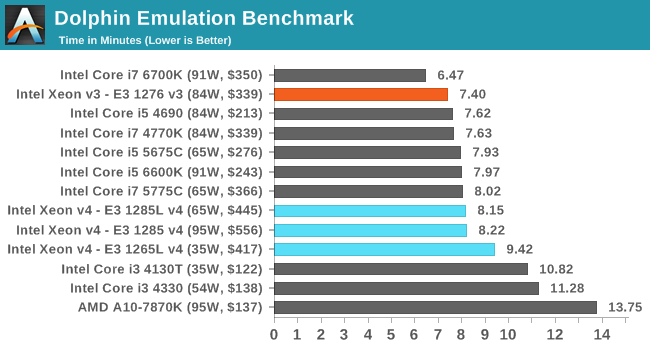
Dolphin prefers single threaded speed and IPC, which the extra frequency of the v3 wins out here. The disparity between the 65W/95W v4 processors and the 35W processor is most obvious here.
WinRAR 5.0.1: link
Our WinRAR test from 2013 is updated to the latest version of WinRAR at the start of 2014. We compress a set of 2867 files across 320 folders totaling 1.52 GB in size – 95% of these files are small typical website files, and the rest (90% of the size) are small 30 second 720p videos.
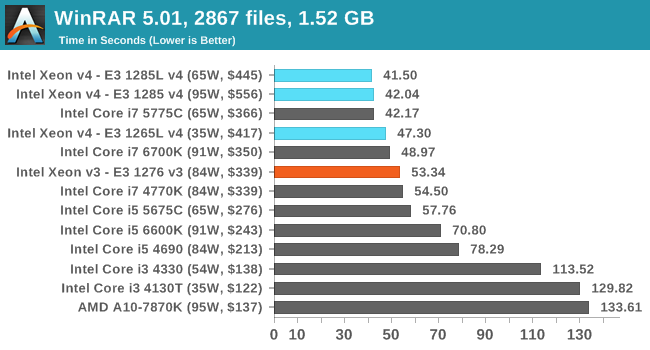
WinRAR is our classic 'eDRAM works here!' benchmark, clearly showing how Broadwell benefits. Although, one might argue that WinRAR is not a typical workload environment. It is also poignant to show that the 95W v4 doesn't win here in this variable-threaded load.
3D Particle Movement
3DPM is a self-penned benchmark, taking basic 3D movement algorithms used in Brownian Motion simulations and testing them for speed. High floating point performance, MHz and IPC wins in the single thread version, whereas the multithread version has to handle the threads and loves more cores.
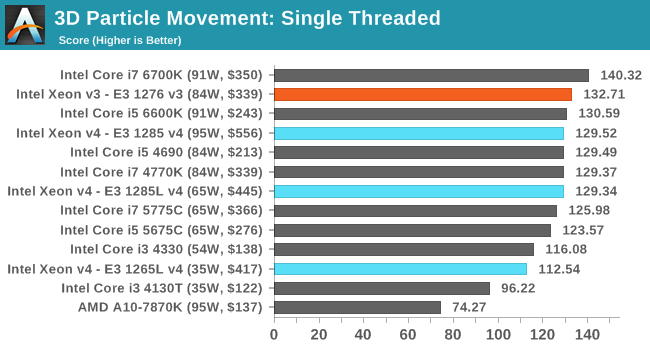
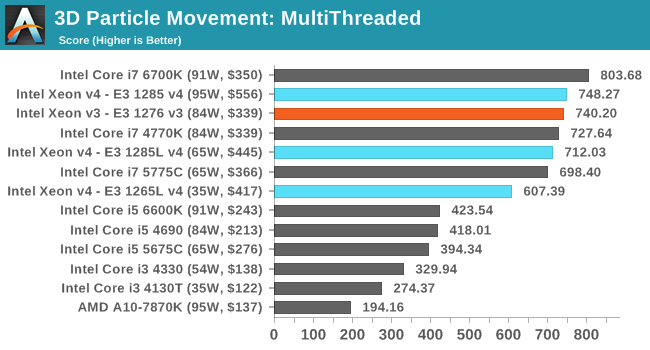
Similar to CineBench, in single threaded mode the v3 wins out due to the faster frequency, but in multithreaded mode the advancements in the Broadwell core due to better thread resource management puts at least the 95W v4 ahead.
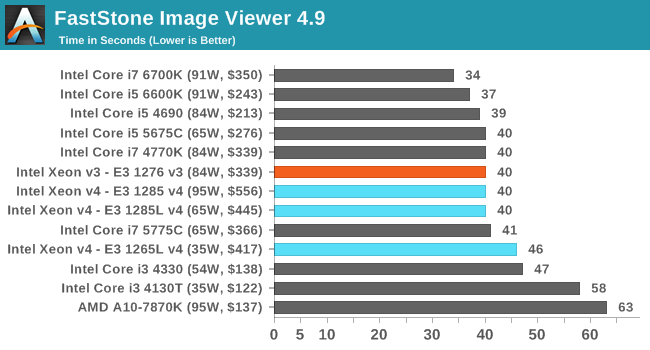
FastStone Image Viewer 4.9
FastStone is the program I use to perform quick or bulk actions on images, such as resizing, adjusting for color and cropping. In our test we take a series of 170 images in various sizes and formats and convert them all into 640x480 .gif files, maintaining the aspect ratio. FastStone does not use multithreading for this test, and results are given in seconds.
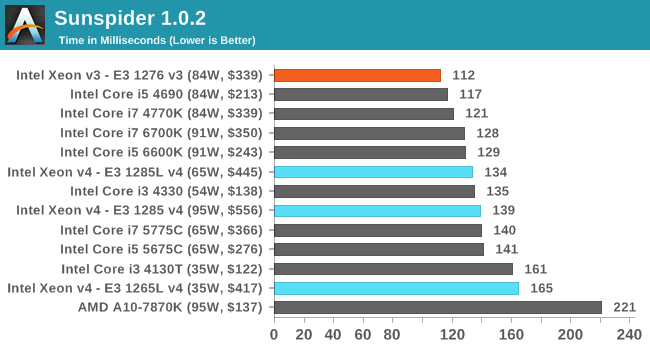
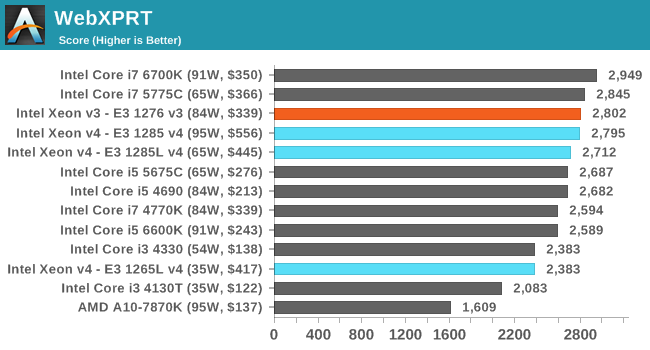
Web Benchmarks
On the lower end processors, general usability is a big factor of experience, especially as we move into the HTML5 era of web browsing. For our web benchmarks, we take four well known tests with Chrome 35 as a consistent browser.
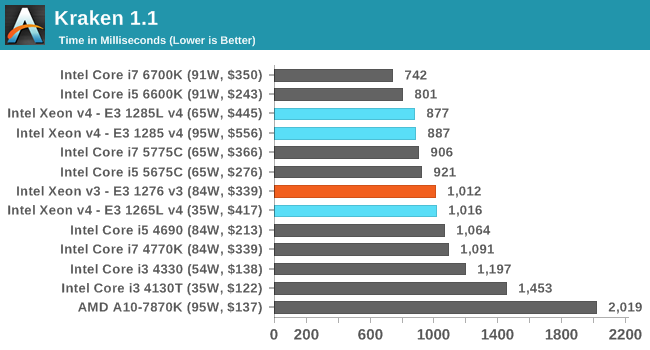
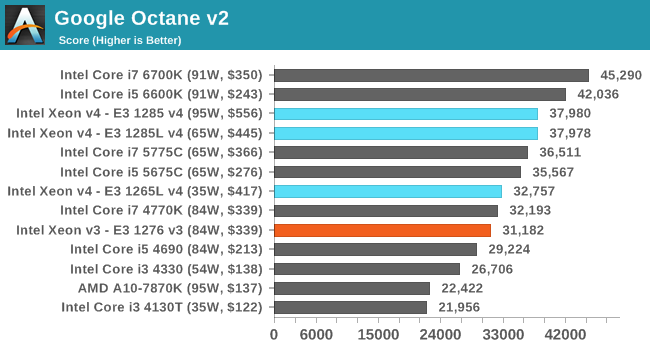
For web implementations, both Kraken and Octane see benefits moving up to Broadwell, but it is worth noting that moving to Skylake is an even better benefit. This again comes down to the management of CPU instructions between threads, and having benefits associated with keeping the knowledge of past instructions or information in lower cache levels. In would seem in this regard, if you count these benchmarks indicative of a real workload, that web-based throughput implementations are more in-flight operation limited than any other resource.


72 Comments
View All Comments
Urizane - Wednesday, August 26, 2015 - link
The R7 240 used on that page isn't exactly fast. Actually, the A10 APU has more graphics hardware than that card, which shows in the results. The fact that Crystal Well parts can beat an A10 APU means that they also beat the R7 240.As far as the 4770R comparison goes, it seems I'm coming up with nothing useful from a quick search. Anandtech has numbers for the 4770R and numbers for the 5675C, but in none of the same benchmarks. Iris Pro 5200 (4770R) had 40 EUs that could turbo to 1.3 GHz and Iris Pro P6300 (E3-1285* v4) has 48 EUs that can turbo to 1.15 GHz (same for 5775C and 1.1 GHz for 5675C). I would think it would be a wash (some wins, some losses) between the two generations, but you're right. There would be some utility in having some hard numbers to compare the two.
alefsin - Wednesday, August 26, 2015 - link
I wish you also included e5-1630 v3 in your tests. It is slightly more expensive ($600 range I guess) but with 6 cores at 3.5 MHz is probably more attractive than the any of faster e3 series.tyger11 - Wednesday, August 26, 2015 - link
Yeah, that's the one I'm thinking about building my video workstation around, unless a 6 core skylake comes out soon.Mastadon - Thursday, August 27, 2015 - link
Skylake Xeons aren't due until 2017.JesseKramer - Wednesday, August 26, 2015 - link
According to Ark the e5-1630 v3 is a 4c8t part.http://ark.intel.com/products/82764/Intel-Xeon-Pro...
alefsin - Thursday, August 27, 2015 - link
Oh, sorry, my bad. I meant E5-1650 V3. I recently built a workstation with that for CFD analysis. 140 W is bit high these days but then again, there is no argument about the performance.Gigaplex - Wednesday, August 26, 2015 - link
"but the main parallel we should be making is the 95W of the E3-1285 v4 and the E3-1276 v3 at 84W. The E3 has some extra frequency (peaks at 4 GHz) and extra L3 cache, but the Xeon has eDRAM."The E3 vs the Xeon? They're both E3 Xeons.
MrSpadge - Wednesday, August 26, 2015 - link
"If I were thinking from the point of view of the motherboard manufacturer, they are more likely to overvolt a Xeon processor to ensure that stability rather than deal with any unstable platforms"Ian, this would be a really really poor move & explanation. You are literally paying Intel for the guaranteed stability of the Xeon. the CPU tells the mainboard exactly which voltage it wants. If a mainboard maker gives it more than this on purpose, he's sabotaging either the TDP and power efficiency, or the performance. Neither is good and could easily lead to lawsuits in the US (because the product wouldn't perform as promised).
In any way, you should be able to check this! You can test on different boards, with different software. You can read out & report the voltages of the CPUs under different load conditions. You can log & report the average CPU clocks during those tests. One would think such information is interesting when we're seemingly confronted with 2 of 3 CPUs consuming far more than promised by Intel and performing really good for that TDP.
Morawka - Wednesday, August 26, 2015 - link
i wish you guys would start putting the i7 4790K in these Skylake/Broadwell Comparisons because the clock speed is identical to the 6770K.Comparing the 6770K to the 4770K is not fair because clock speeds are different.
Oxford Guy - Wednesday, August 26, 2015 - link
Anandtech refuses to include the AMD FX 8 core in its results charts and instead only includes weaker APUs.