Kingston HyperX 3K (240GB) SSD Review
by Anand Lal Shimpi on April 10, 2012 3:00 AM ESTAnandTech Storage Bench 2011
Two years ago we introduced our AnandTech Storage Bench, a suite of benchmarks that took traces of real OS/application usage and played them back in a repeatable manner. I assembled the traces myself out of frustration with the majority of what we have today in terms of SSD benchmarks.
Although the AnandTech Storage Bench tests did a good job of characterizing SSD performance, they weren't stressful enough. All of the tests performed less than 10GB of reads/writes and typically involved only 4GB of writes specifically. That's not even enough exceed the spare area on most SSDs. Most canned SSD benchmarks don't even come close to writing a single gigabyte of data, but that doesn't mean that simply writing 4GB is acceptable.
Originally I kept the benchmarks short enough that they wouldn't be a burden to run (~30 minutes) but long enough that they were representative of what a power user might do with their system.
Not too long ago I tweeted that I had created what I referred to as the Mother of All SSD Benchmarks (MOASB). Rather than only writing 4GB of data to the drive, this benchmark writes 106.32GB. It's the load you'd put on a drive after nearly two weeks of constant usage. And it takes a *long* time to run.
1) The MOASB, officially called AnandTech Storage Bench 2011 - Heavy Workload, mainly focuses on the times when your I/O activity is the highest. There is a lot of downloading and application installing that happens during the course of this test. My thinking was that it's during application installs, file copies, downloading and multitasking with all of this that you can really notice performance differences between drives.
2) I tried to cover as many bases as possible with the software I incorporated into this test. There's a lot of photo editing in Photoshop, HTML editing in Dreamweaver, web browsing, game playing/level loading (Starcraft II & WoW are both a part of the test) as well as general use stuff (application installing, virus scanning). I included a large amount of email downloading, document creation and editing as well. To top it all off I even use Visual Studio 2008 to build Chromium during the test.
The test has 2,168,893 read operations and 1,783,447 write operations. The IO breakdown is as follows:
| AnandTech Storage Bench 2011 - Heavy Workload IO Breakdown | ||||
| IO Size | % of Total | |||
| 4KB | 28% | |||
| 16KB | 10% | |||
| 32KB | 10% | |||
| 64KB | 4% | |||
Only 42% of all operations are sequential, the rest range from pseudo to fully random (with most falling in the pseudo-random category). Average queue depth is 4.625 IOs, with 59% of operations taking place in an IO queue of 1.
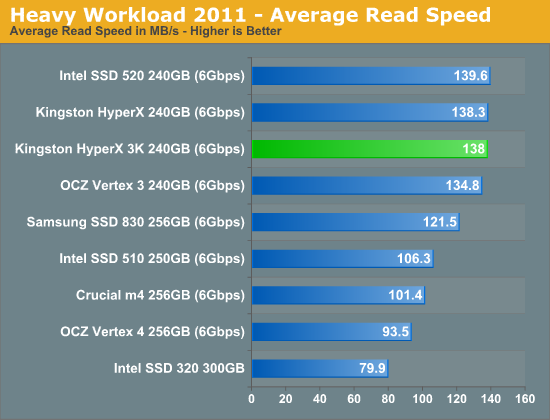
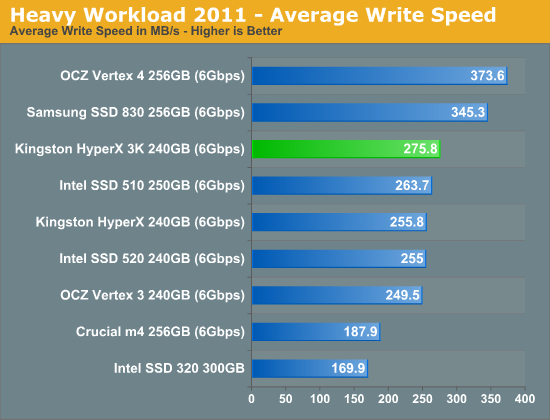
Many of you have asked for a better way to really characterize performance. Simply looking at IOPS doesn't really say much. As a result I'm going to be presenting Storage Bench 2011 data in a slightly different way. We'll have performance represented as Average MB/s, with higher numbers being better. At the same time I'll be reporting how long the SSD was busy while running this test. These disk busy graphs will show you exactly how much time was shaved off by using a faster drive vs. a slower one during the course of this test. Finally, I will also break out performance into reads, writes and combined. The reason I do this is to help balance out the fact that this test is unusually write intensive, which can often hide the benefits of a drive with good read performance.
There's also a new light workload for 2011. This is a far more reasonable, typical every day use case benchmark. Lots of web browsing, photo editing (but with a greater focus on photo consumption), video playback as well as some application installs and gaming. This test isn't nearly as write intensive as the MOASB but it's still multiple times more write intensive than what we were running in 2010.
As always I don't believe that these two benchmarks alone are enough to characterize the performance of a drive, but hopefully along with the rest of our tests they will help provide a better idea.
The testbed for Storage Bench 2011 has changed as well. We're now using a Sandy Bridge platform with full 6Gbps support for these tests.
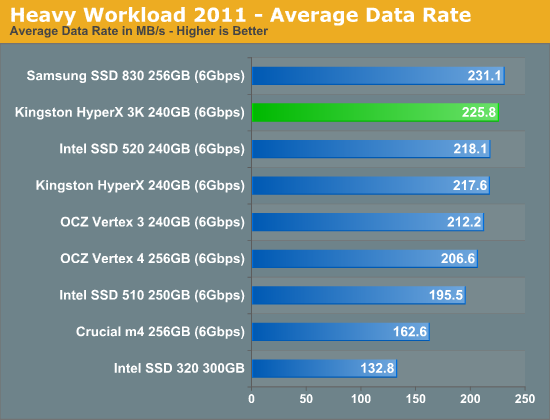
AnandTech Storage Bench 2011 - Heavy Workload
We'll start out by looking at average data rate throughout our heavy workload test:
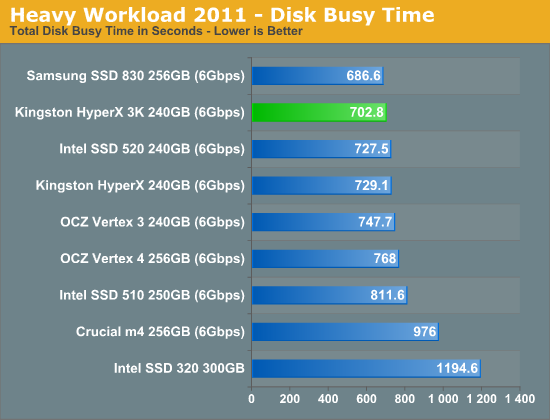
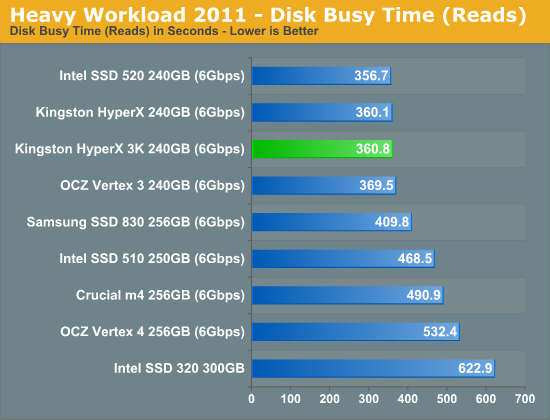
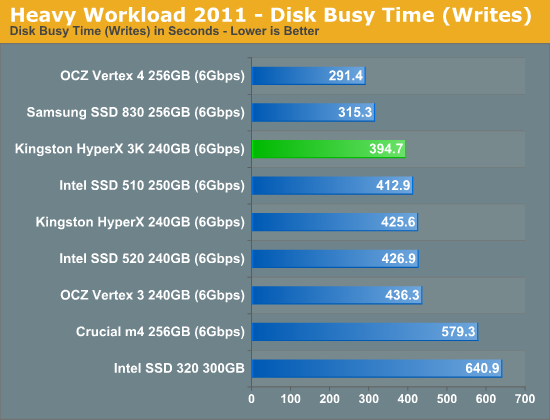
The next three charts just represent the same data, but in a different manner. Instead of looking at average data rate, we're looking at how long the disk was busy for during this entire test. Note that disk busy time excludes any and all idles, this is just how long the SSD was busy doing something:


44 Comments
View All Comments
Coup27 - Tuesday, April 10, 2012 - link
the last page is missingCoup27 - Tuesday, April 10, 2012 - link
also all easter weekend I've had rendering issues with the comments section. It doesn't load up correctly and it's like a text version instead of html. This has happened on 3 different PC's so I think its something with the site.Ryan Smith - Tuesday, April 10, 2012 - link
What browser are you on? To the best of my knowledge we are not currently having any site issues, and at the moment the comments section is working fine for me.bji - Tuesday, April 10, 2012 - link
A similar thing happened for me too with several stores in the past few days. The comments section would show up without indentation (all comments lined up at the left) and comments would be separated by some weird looking title bar (looked a little like an Apple candy theme thing from the early 2000's, only clunkier). A reload of the page would bring it back to the normal view. My browser is Firefox on Linux.bji - Tuesday, April 10, 2012 - link
stores -> storiesHockster - Wednesday, April 11, 2012 - link
I'm using the latest Firefox and don't see the last page either.Hockster - Wednesday, April 11, 2012 - link
Oops, didn't realize there wasn't a conclusion page.Ryan Smith - Tuesday, April 10, 2012 - link
Actually the last page is there; it just isn't a conclusion page. We went with something a bit different this time and did an abridged review since it's using a controller & NAND we've already reviewed. The first page is the complete review from an editorial standpoint, while the following pages are all of the benchmarks and analysis.-Thanks
Ryan Smith
Coup27 - Tuesday, April 10, 2012 - link
tbh I missed that. I hadn't read the article and thought the end had been chopped off by this rendering issue. I have just uploaded a screenshot of what happens. This is the 4th PC in 3 different places it's happened on so it must be the site:http://www.elmleigh.co.uk/Paul/ATissue.jpg
Ryan Smith - Tuesday, April 10, 2012 - link
Humm, from that screenshot it looks like you're not getting part or all of the main style sheet. All I can really suggest is flushing your cache and disabling any add-ons. The style sheet is being served up correctly and hasn't changed in the better part of the last year.http://www.anandtech.com/content/main.css