Intel Haswell-EP Xeon 12 Core Review: E5-2650L V3 and E5-2690 V3
by Ian Cutress on November 6, 2014 9:00 AM EST- Posted in
- CPUs
- IT Computing
- Intel
- Xeon
- Enterprise
- LGA2011-3
- Haswell EP
Linux Performance
Built around several freely available benchmarks for Linux, Linux-Bench is a project spearheaded by Patrick at ServeTheHome to streamline about a dozen of these tests in a single neat package run via a set of three commands using an Ubuntu 14.04 LiveCD. These tests include fluid dynamics used by NASA, ray-tracing, OpenSSL, molecular modeling, and a scalable data structure server for web deployments. We run Linux-Bench and have chosen to report a select few of the tests that rely on CPU and DRAM speed.
Unfortunately due to the different time windows we had these CPUs and the time of introduction of Linux-Bench into the normal testing suite, we only have results for the 2P and 1P E5-2650L V3 configurations.
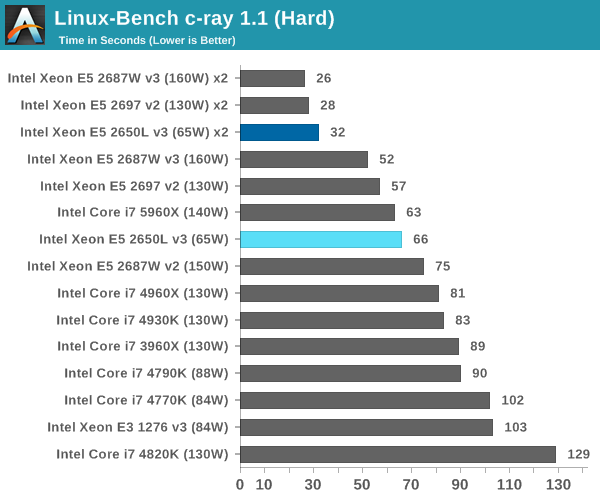
C-Ray: link
C-Ray is a simple ray-tracing program that focuses almost exclusively on processor performance rather than DRAM access. The test in Linux-Bench renders a heavy complex scene offering a large scalable scenario.
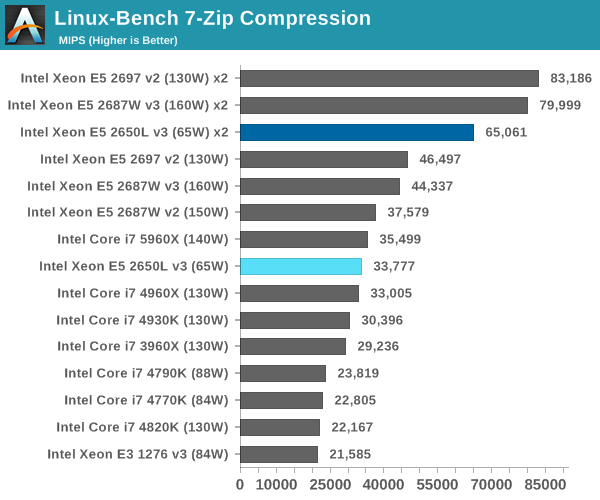
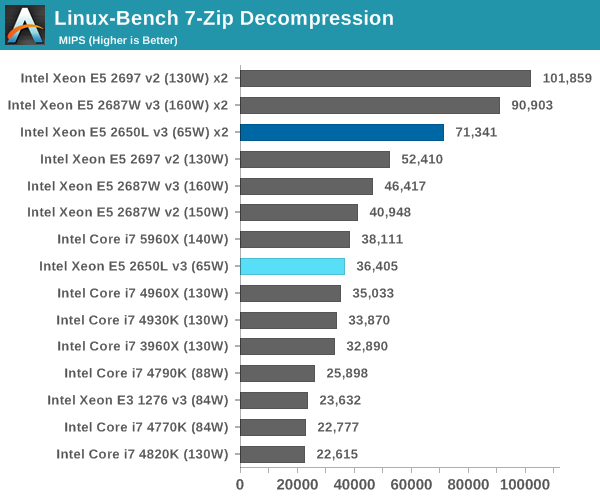
p7zip Compression and Decompression
7-Zip is a common open source compression and decompression tool for data transfer.
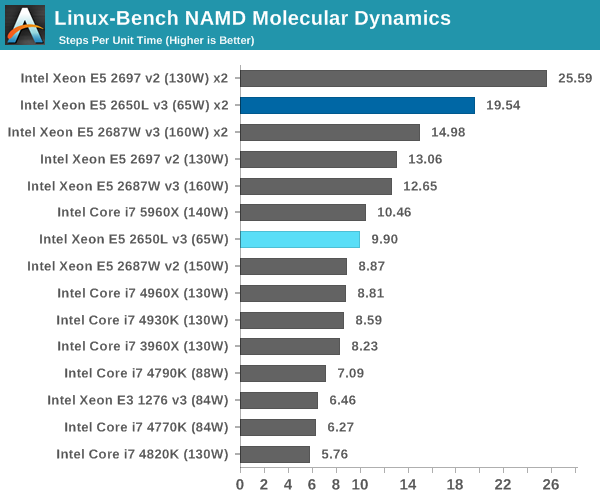
NAMD, Scalable Molecular Dynamics: link
Developed by the Theoretical and Computational Biophysics Group at the University of Illinois at Urbana-Champaign, NAMD is a set of parallel molecular dynamics codes for extreme parallelization up to and beyond 200,000 cores. The reference paper detailing NAMD has over 4000 citations, and our testing runs a small simulation where the calculation steps per unit time is the output vector.
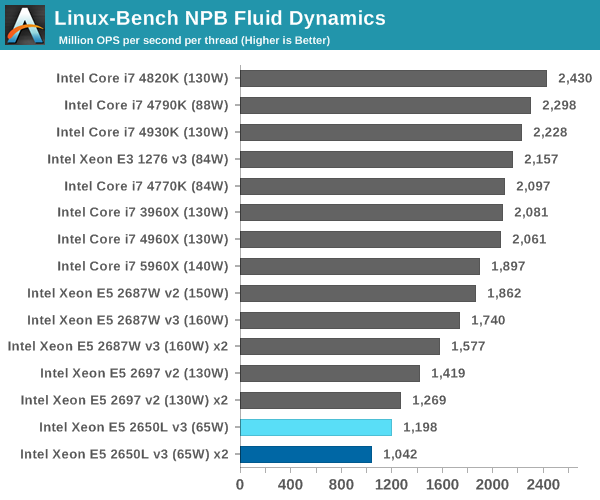
NPB, Fluid Dynamics: link
Aside from LINPACK, there are many other ways to benchmark supercomputers in terms of how effective they are for various types of mathematical processes. The NAS Parallel Benchmarks (NPB) are a set of small programs originally designed for NASA to test their supercomputers in terms of fluid dynamics simulations, useful for airflow reactions and design.
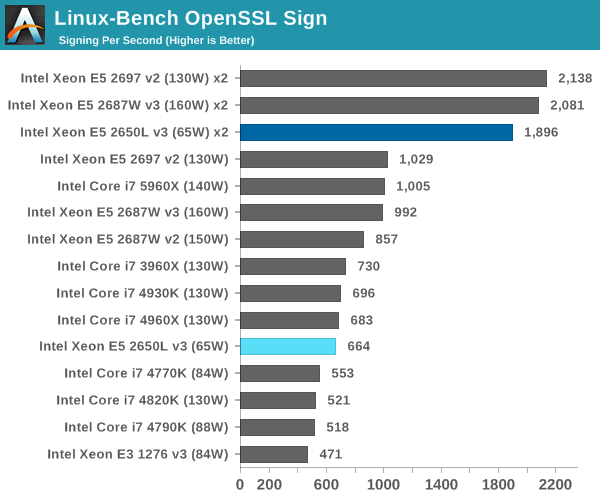
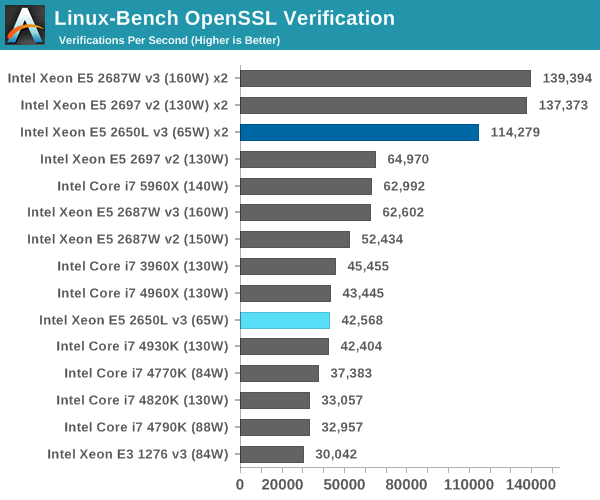
OpenSSL Sign/Verify
OpenSSL is the platform that secures the majority of the websites we visit, and being able to issue/verify this security is paramount to performance. We test the rates at which OpenSSL certificates are signed and verified.
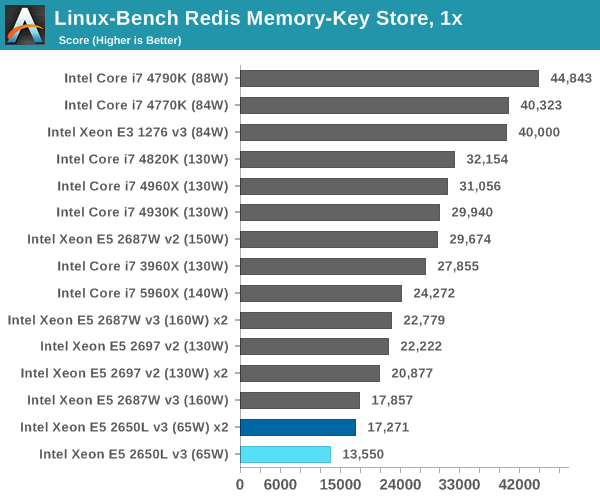
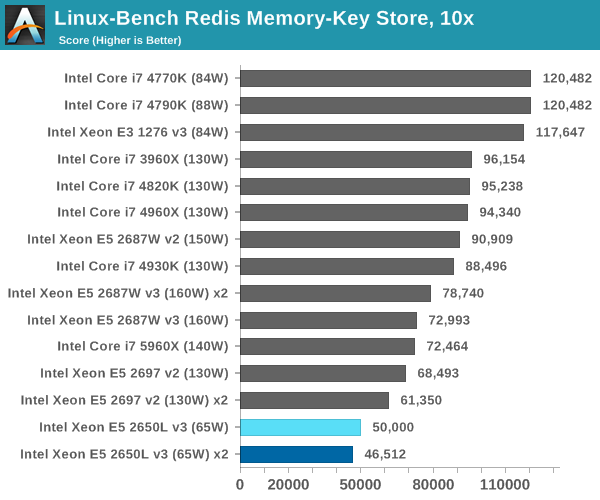
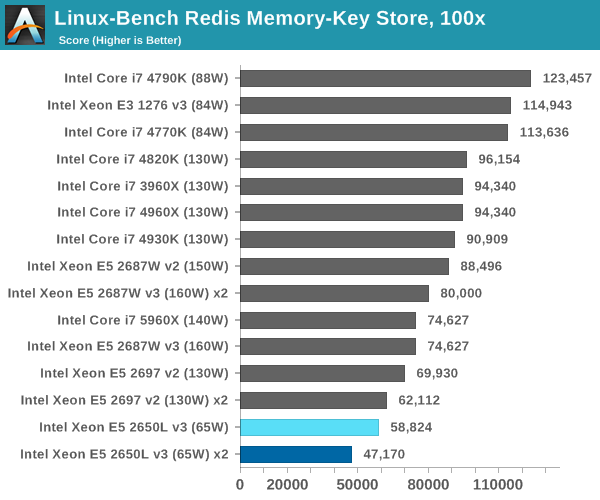
Redis: link
Many of the online applications rely on key-value caches and data structure servers to operate. Redis is an open-source, scalable web technology with a srtong developer base, but also relies heavily on memory bandwidth as well as CPU performance.


52 Comments
View All Comments
XZerg - Thursday, November 6, 2014 - link
I really dislike the Power Consumpution Delta chart. Could you please go back to separate Idle chart and Load chart?Mikemk - Thursday, November 6, 2014 - link
+1klagermkii - Thursday, November 6, 2014 - link
I don't understand the purpose of that chart. It leaves too much ambiguity between CPUs that are efficient at load vs CPUs that just have poor idle power management.ziorus - Thursday, November 6, 2014 - link
100% agree with XZerg. I was coming to this site because you had the idle and load charts. Those two infos really are needed. Not this delta chart. We do not even know where power consumption in watts at idle starts to add in the numbers.Guspaz - Thursday, November 6, 2014 - link
Agreed. The delta is basically useless information, because it gives a CPU with a power range of 10W-20W and a CPU with a power range of 100W-110W the same score, and tells us nothing about how much power the part actually draws (so we can't use the info to size PSUs) or how much heat it might produce (so we can't use the info to size cooling).The delta is, without the idle/load, completely meaningless.
Schafdog - Thursday, November 6, 2014 - link
I want to join the club to complain on only one (delta) power measurement. Idle is important. Max is important.MrCommunistGen - Saturday, November 8, 2014 - link
I think that the Delta chart is designed to give an apples to apples comparison of how much power the CPU itself consumes under load. The platforms of all of those systems are vastly different. There's a range of motherboards from single socket consumer IVB to dual socket workstation/server Haswell and everything in between. While a comparison of raw platform power under idle and load certainly bears its own merit and and represents an interesting set of figures, it does not provide a meaningful comparison for the subject of this article - a CPU.Delta power allows for all kinds of comparisons. Regardless of motherboard, RAM, etc you can establish that a given CPU will use (approximately) X number of watts under load. If you then provide performance figures for that load, you can get the compute efficiency of the CPU. In big data clusters, especially ones that primarily perform a specific workload this is an important figure.
0ldman79 - Monday, November 10, 2014 - link
Delta chart is fine. We still want to see idle and max load.Call me old fashioned.
danjw - Thursday, November 6, 2014 - link
First paragraph in "Market" "bandwidth contained applications" should be "bandwidth constrained applications", I think.rocketscience315 - Thursday, November 6, 2014 - link
Um, isn't the Frequency Response graph missing the 2648L?