ASRock Rack C2750D4I and U-NAS NSC-800: A DIY File Server
by Ganesh T S on August 10, 2015 8:45 AM EST- Posted in
- NAS
- storage server
- Avoton
- ASRock Rack
- U-NAS
Performance Metrics - Phoronix Test Suite
The file server's BIOS settings allow it boot off a USB key. We had no trouble doing the same with a portable installation of Ubuntu 14.04 (kernel version 3.16).
Database Benchmarks
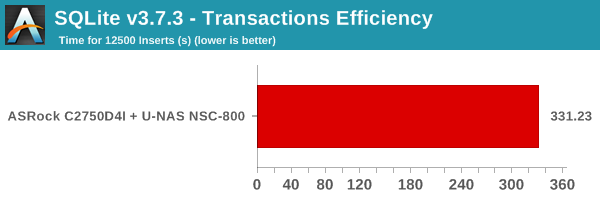
The first test we look at involves determination of the time taken to perform 12500 record insertions into an indexed database. We use SQLite v3.7.3. SQLite performance depends to a large extent on the capabilities of the CPU. Benchmarks from other systems can be viewed on OpenBenchmarking.org.
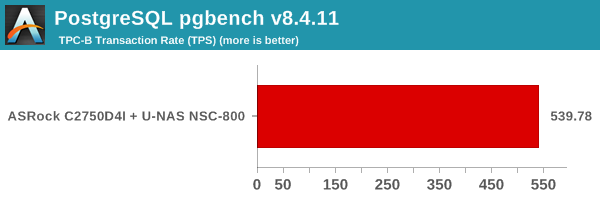
The pgbench database benchmark involves recording the transaction rate for database operations using PostgreSQL. Unlike SQLite insertions-only test, pgbench is based on TPC-B, running five SELECT, UPDATE and INSERT commands per transaction.
Benchmarks from other systems can be viewed on OpenBenchmark.org
Web Server Benchmarks
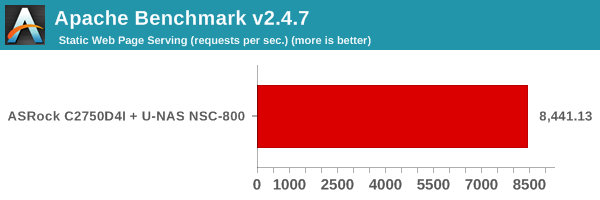
The NGINX and Apache benchmarks record the number of static web page requests that can be serviced in a given time interval. It gives an idea of the load that can be handled if a given system were to be configured as a web server. The test load consists of a total of 500K requests (for NGINX) / 1M requests (for Apache) with 100 concurrent ones.

Benchmark numbers for both of these are available on OpenBenchmarking.org (NGINX, Apache).
TCP Loopback
The efficiency of the networking stack in the system (not to be confused with the hardware network adapter itself) can be determined by measures the loopback TCP performance. We record the time taken to transfer 10GB of data via loopback.
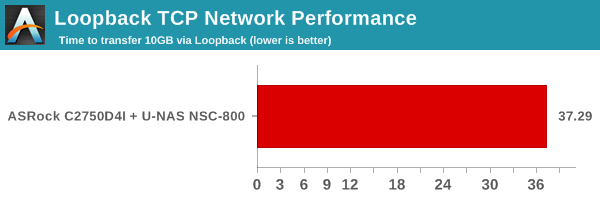
Given that we have the same networking stack for a given OS release across different hardware configurations, the efficiency is going to vary based solely on the CPU capabilities again. Benchmarks from other systems can be viewed on OpenBenchmarking.org.
CacheBench
CacheBench is an artificial benchmark to determine the performance of the cache and DRAM components in a system. It consists of three profiles - reads, writes and read/modify/writes. The bandwidth is recorded for each profile, with bigger numbers indicating better performance.
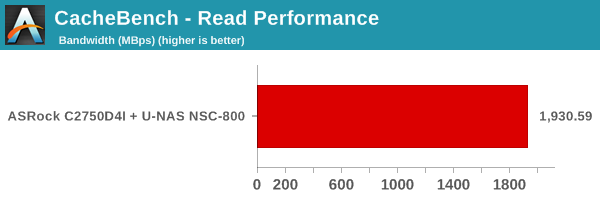
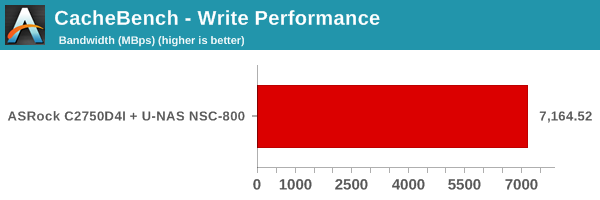
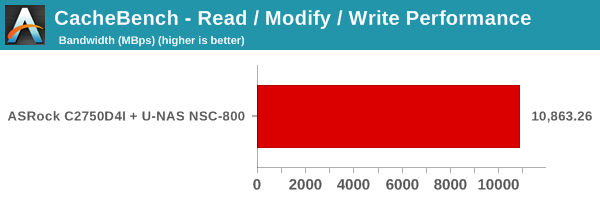
The numbers depend on the internal cache access speeds as well as the speed of the DRAM in the system. Benchmarks from other systems can be viewed on OpenBenchmarking.org
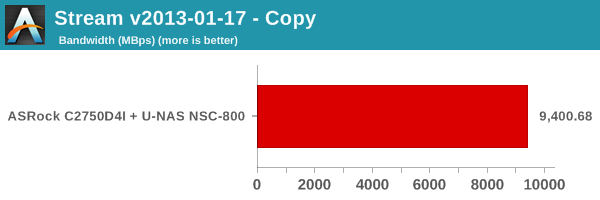
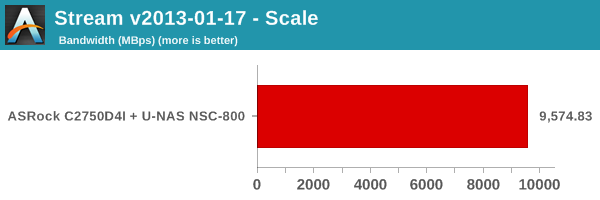
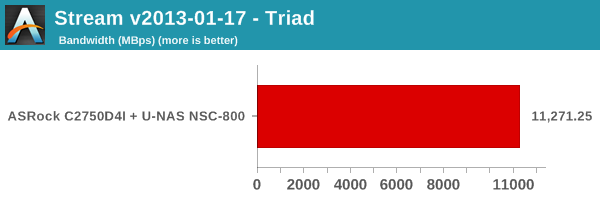
Stream
The system memory is tested out using the stream benchmark. The STREAM benchmark is a simple, synthetic benchmark designed to measure sustainable memory bandwidth (in MB/s) and a corresponding computation rate for four simple vector kernels (Copy, Scale, Add and Triad).

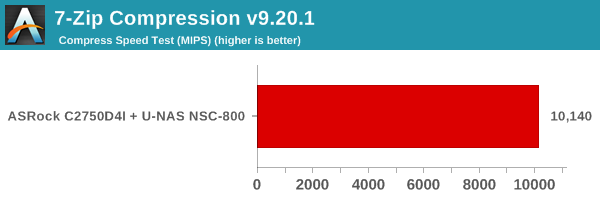
7-Zip Compression
The 7-Zip compression benchmark records the MIPS for the compression mode. This is the same benchmark that we use in the evaluation of mini-PCs, except that this is based on the Linux version. Higher MIPS ratings correspond to better performance, and the numbers are primarily based on the performance of the CPU in the system.
Benchmark numbers for other systems can be viewed on OpenBenchmarking.org
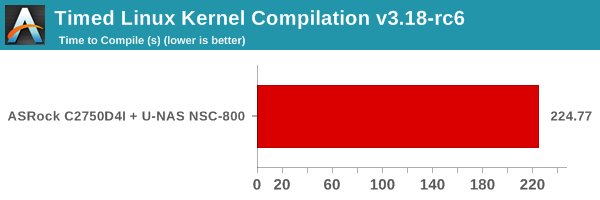
Linux Kernel Compilation
The timed Linux kernel compilation benchmark records the time taken to build the Linux 3.18 kernel. It is a good multi-discipline benchmark, stressing multiple aspects of the system including the DRAM, CPU and, to a certain extent, even the storage.
Benchmark numbers for other systems can be viewed on OpenBenchmarking.org
C-Ray
C-Ray is a simple raytracer designed to evaluate the floating point performance of a CPU. This is a multi-threaded test, and the time taken to complete the routine is recorded.
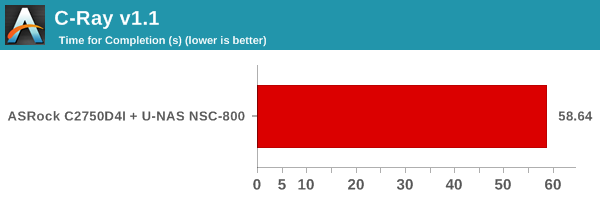
Benchmark numbers for other systems can be viewed on OpenBenchmarking.org


48 Comments
View All Comments
damianrobertjones - Monday, August 10, 2015 - link
Any chance of adding the price to the top of the page? I can then evaluate suitability etc.SirGCal - Monday, August 10, 2015 - link
I saw it a few times throughout the article including the top page. $845colinstu - Monday, August 10, 2015 - link
What's with the benchmarks that aren't compared to anything else?ganeshts - Monday, August 10, 2015 - link
This is the first of three file servers that we are reviewing with a completely new evaluation methodology. Since we are just starting out, there are no comparison numbers, but I do link to OpenBenchmarking.org pages for each of the tests - so one can see what other systems are capable of with respect to that benchmark.DanNeely - Monday, August 10, 2015 - link
I think U-NAS deserves more credit for the compactness of their case designs. Being much bulkier than units from Synology/etc has always been an issue for anyone in a space constrained situation (or just with a spouse who grumbles about how much space all of your toys takes up). This case is only 15% larger in volume than Synologies DS1815+ (12.4 vs 14.4 liters); and their 4 bay model comes even closer to the DS414 (7.8 vs 8.7l).Assuming I decide on a DIY box to replace my WHS2011 box in a few months, the U-NAS NSC-400 is exactly what I'm looking for in a chassis (and half the size of the box it'd be replacing).
xicaque - Monday, November 23, 2015 - link
I have built two of these units. I am very happy with them. for 200bucks (case only with some wires) is not a bad deal. I am running freenas.DanNeely - Monday, August 10, 2015 - link
Do you have any power consumption numbers available?Johnmcl7 - Monday, August 10, 2015 - link
There are some power figures on the last page, 70W under load and 38W idle.DanNeely - Monday, August 10, 2015 - link
two numbers in the text is a far cry from the normal table showing rebuild times and power levels shown in a normal NAS review.ganeshts - Monday, August 10, 2015 - link
Dan, Yes, it felt a bit odd for me to leave out that table in a NAS review.. The issue for me is that it is not worth it to spend more than 'N' hours on evaluating a particular system / review a particular product, and setting up the SPEC SFS 2014 benchmarks and processing it took a lot of time.I hope to address this issue in future file server reviews (now that SPEC SFS 2014 seems to be stable), but not for the next two (which have already been evaluated and are just pending write-up)