The Samsung Galaxy Note5 and Galaxy S6 edge+ Review
by Joshua Ho on October 2, 2015 8:00 AM ESTSystem Performance Cont'd
Now that we’ve covered some of the traditionally CPU-bound tests, we can start to look at tests that more strongly emphasize GPU performance. It’s worth noting here that while 3DMark is supposed to determine gaming and graphics performance, the overall score includes a CPU performance component in the form of a physics test that means it isn't much of a pure GPU test.
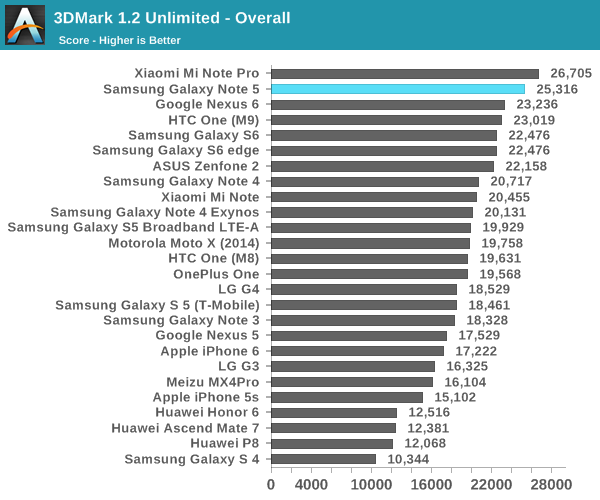
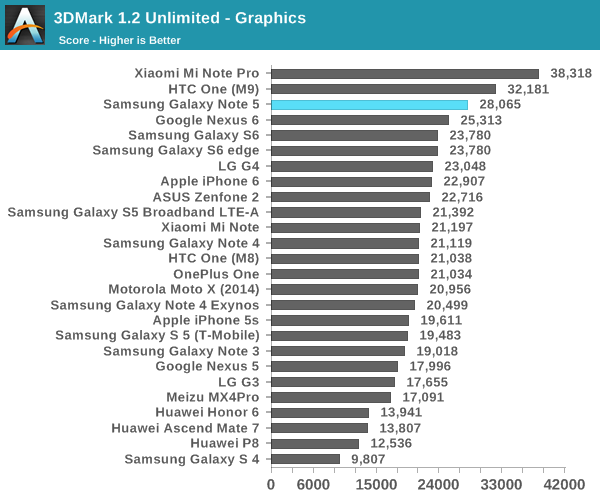
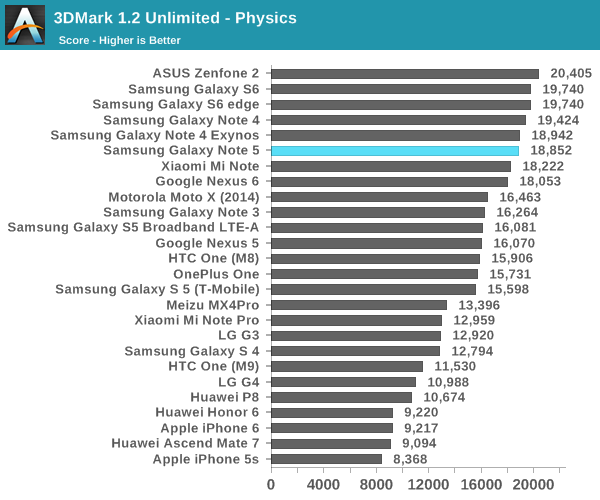
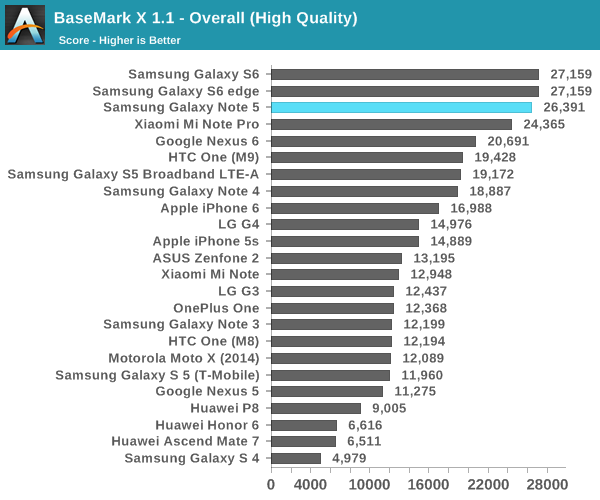
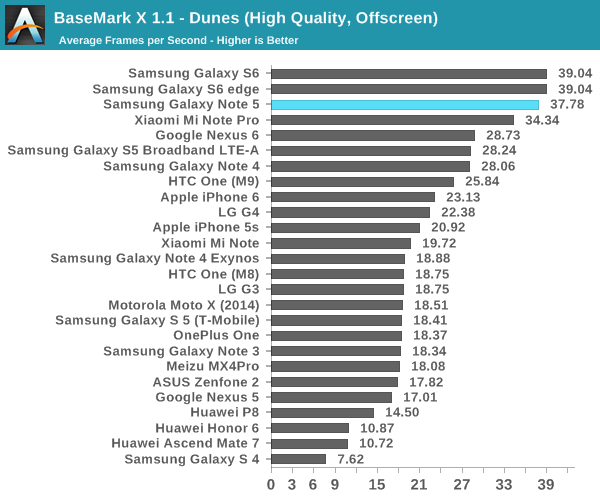
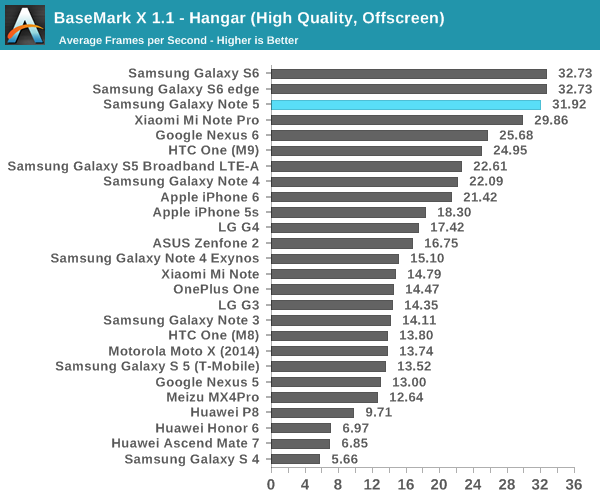
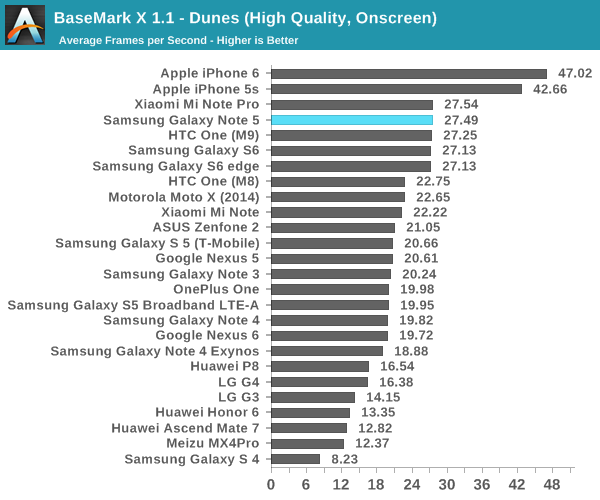
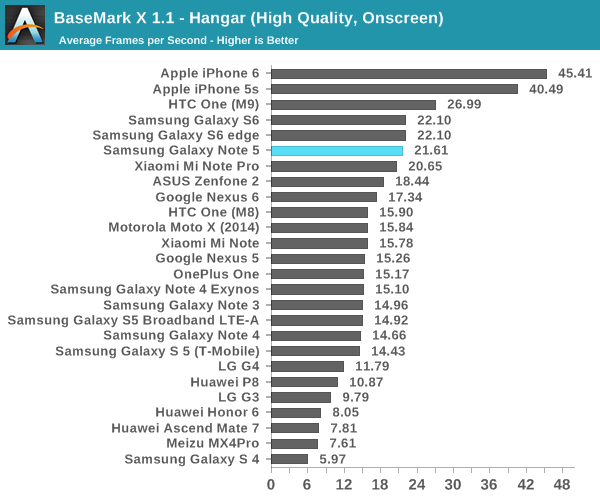
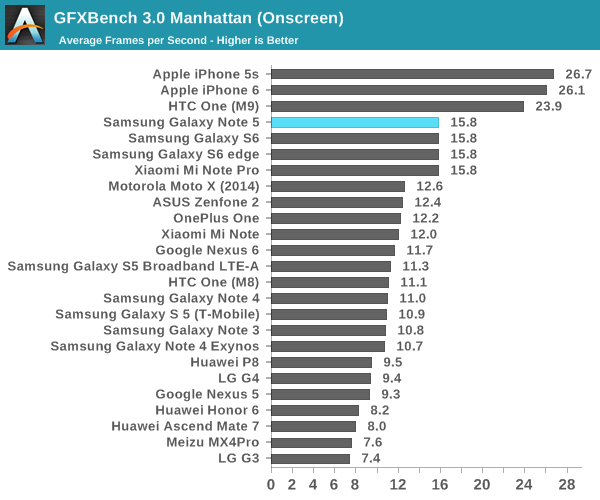
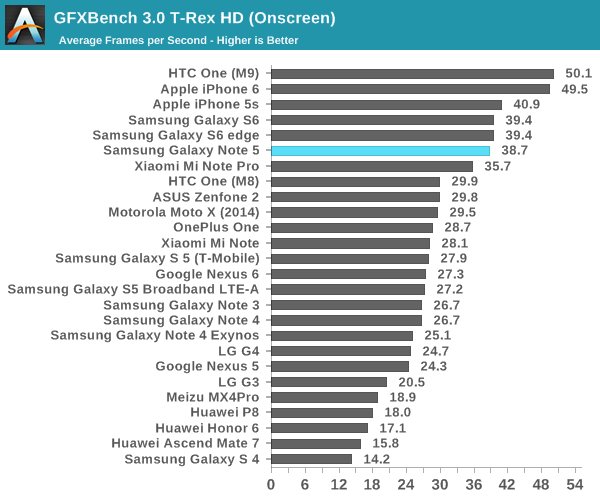
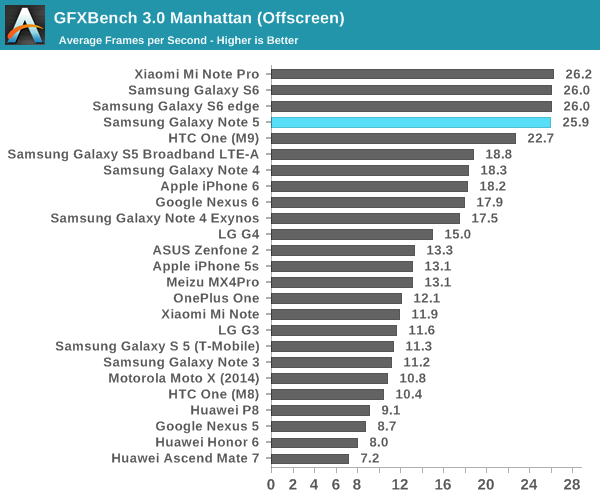
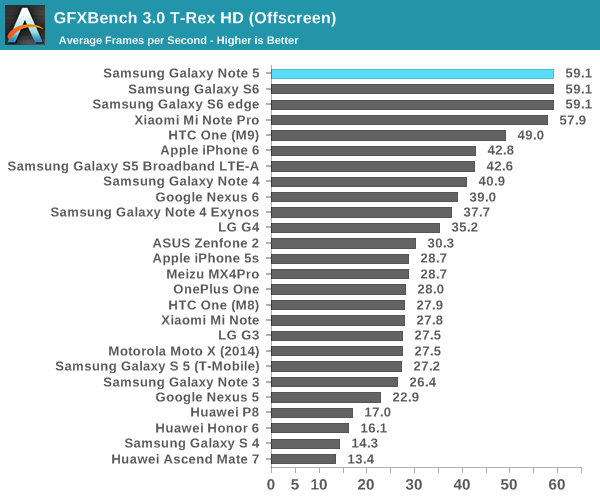
Overall, there's nothing really surprising about these results. The Exynos 7420 should continue to deliver great GPU performance for anyone interested in a high-end phablet or smartphone. There are some improvements in 3DMark in regards to graphics performance, but it's likely that we're just looking at newer drivers as the GPU doesn't heat up fast enough for throttling to be affecting these results.
NAND Performance
At this point, it’s probably not a surprise to know that NAND performance can have very real effects on user experience. If an OEM decides to skimp heavily on storage in order to drive the price down, it’s at least somewhat likely that the device will start to exhibit major IO pauses at some point in the device lifecycle. In order to test this, we rely on our standard storage tests which include Androbench with some custom settings to get more realistic test results along with StorageBench for iOS which is comparable to Androbench.
In the case of the Galaxy Note5 we’re still looking at a UFS storage solution similar to what was found in the Galaxy S6, but it looks like this is slightly newer as the storage is identified as a Toshiba THGLF2G8J4LBATDA chip rather than the Samsung variant that was found in the Galaxy S6. It’s unclear whether Samsung is now multi-sourcing UFS storage for their mobile devices or what distribution exists here.
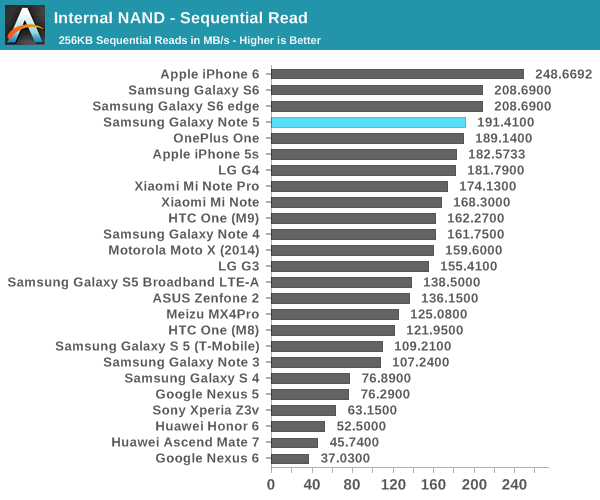
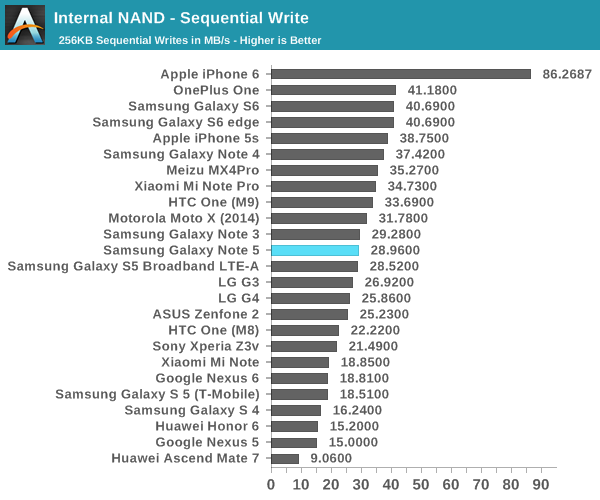
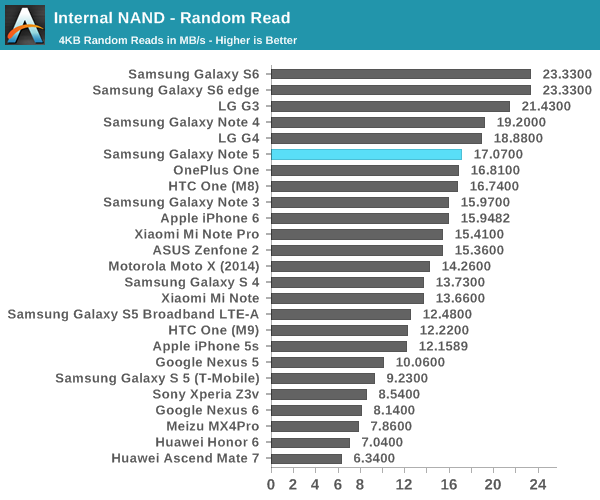
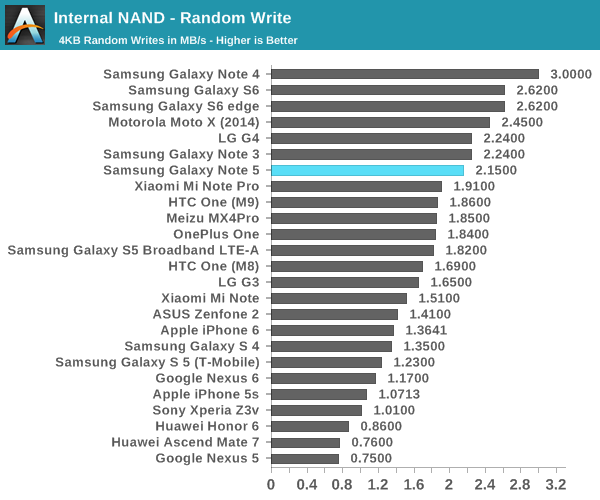
Interestingly, the Note5 regresses a little bit in storage performance relative to the Galaxy S6, which is likely due to the shift to Toshiba's NAND. However, this difference is small enough that in everyday use it's unlikely that it will be noticed. Performance over time should be acceptable as well.


225 Comments
View All Comments
ciderrules - Saturday, October 3, 2015 - link
Who said anything about overclocking?Geekbench aggregates thousands of scores to get their numbers. I think I'll accept their results over those posted online. Especially by someone like Kuzi, who seems to hate Apple so much that he feels the need to lie online to make a point.
BTW, I also refer to Geekbench themselves for iPhone scores, before someone claims bias.
Kuzi - Monday, October 5, 2015 - link
Lie about what? You can find Geekbench multicore numbers for Galaxy devices on many review sites, an example is below:http://www.gsmarena.com/samsung_galaxy_note5-revie...
Kuzi - Monday, October 5, 2015 - link
More Geekbench numbers here:http://www.greenbot.com/article/2973534/smartphone...
Kuzi - Saturday, October 3, 2015 - link
I just tested Galaxy S6 and got 1505 single and 5264 multi on Geekbench.Running Android 5.1.1 here.
Kuzi - Saturday, October 3, 2015 - link
GSM Arena also getting same numbers as me:http://www.gsmarena.com/apple_iphone_6s-review-131...
Tech_guy - Friday, October 2, 2015 - link
GFXBench is a graphics test. Geekbench is a cpu test so that's why the scores are direct, they're feeding student things. Where did you get 5600 Geekbench multi-core score from? That's an inflated number vs Geekbench's own charts.mercucu1111 - Friday, October 2, 2015 - link
I mean CPU Perf of Exynos is much higher but GPU Perf of Apple Ax chip is much higher.So We can't say which is better
ciderrules - Saturday, October 3, 2015 - link
Not according to Primate Labs. You know, the people who actually CREATED Geekbench.flashbacck - Friday, October 2, 2015 - link
What ever happened to the benchmark cheating that was happening with some android phones? Is that no longer happening?KoolAidMan1 - Saturday, October 3, 2015 - link
I assume its not happening, otherwise their results wouldn't be there in the first place.Maybe the slipped through but I doubt it. Anandtech is incredibly thorough.